

Example demonstrating the differrence between PUT and FairPUT,
and also the fact that FairPUT is the exact mirror image of CALL:
Code:S=100.00 K=100.00 s=30% t=1.0 r=0.0 q=0.0 : CALL : Value=11.923538 Delta=0.559618 MyDelta=0.500000 Gamma=0.013149 Vega=0.394479 Theta=-0.016211 Rho=0.440382 ... PUT : Value=11.923538 Delta=-0.440382 MyDelta=-0.500000 Gamma=0.013149 Vega=0.394479 Theta=-0.016211 Rho=-0.559618 ... FairPUT: Value and other params same as CALL Call, Put, and FairPut all have the same params and do cost all the same. Now let's say the options expire at spot 120: CALL : Payout=20.000000 Profit=8.076462(67.74%) PUT : Payout=0.000000 Profit=-11.923538(-100.00%) FairPUT: Payout=0.000000 Profit=-11.923538(-100.00%) Now let's say the options expire at spot 83.333333: CALL : Payout=0.000000 Profit=-11.923538(-100.00%) PUT : Payout=16.666667 Profit=4.743129(39.78%) FairPUT: Payout=20.000000 Profit=8.076462(67.74%)
Do you see the difference in the payouts of PUT and FairPUT ?
Spot 120 and Spot 83.333333 are same standard deviations (+/- 0.607739) apart from the strike,
so both sides have the same probability to expire at these boundaries. Then of course also
the payout has to be equal (to that of CALL), which indeed is the case with FairPUT, but not with PUT.
As can be further seen, FairPUT is the exact mirror image of CALL.
Q.E.D.
Instruments with lognormal price distributions such as equities have skewed and asymmetric standard deviations. A one standard deviation move higher will have a higher payout than a one standard deviation move lower when the price distribution is positively skewed in assets such as stocks.
The payout will NOT be equal on a 1 SD move with a lognormal price distribution assumption. The mean of a stock's potential price range is to the right (upside) of the ATM strike. That mean moves higher in price terms as volatility increases. Therefore a 1 standard deviation higher move from the mean will naturally be further away from the current ATM/spot price than a 1 standard deviation move lower. You are trying disprove some basic statistical theory.
Lognormal vs Normal distribution:
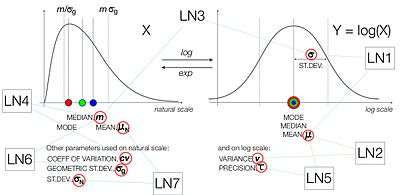

Look where the mean is for a lognormal dist vs a normal dist. The 1 standard deviation (variance from the mean) is going to be much further to the right (higher stock price) than it is to the left (lower stock price).

