new insights for identifying trends as they occur

A problem that has plagued many technicians is that elusive search for the 'right' indicator or chart pattern to emerge that will lead the trader to have profits. It turns out this search is a result of the trader's attempt to make up for the lag of the indicator or predictive method when analyzing price action (usually with a price chart, but it can be an excel spreadsheet, dom, level 2, etc.

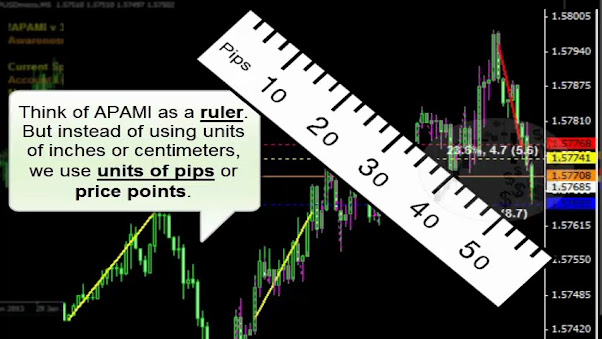
If there was a method that could determine trend direction in real time without averaging historical prices or attempting to predict future price patterns, then at least one of the problems facing technical analysis (TA) would be resolved APAMI for metatrader 4/5 is a real-life example of how coincident price action can be observed and measured in practice. Attached pdf is the abstract for the whitepaper that explains how concurrent trends can be measured without the lag, guessing, or repainting.


There's still the 'problem' of what to do once the trend has been identified, but in my experience that is much more obvious once the trend direction is clear :D

What do you think of the possibilities of coincident price trends?
 

Attachments

Quote from ybfjax:

A problem that has plagued many technicians is that elusive search for the 'right' indicator or chart pattern to emerge that will lead the trader to have profits. It turns out this search is a result of the trader's attempt to make up for the lag of the indicator or predictive method when analyzing price action (usually with a price chart, but it can be an excel spreadsheet, dom, level 2, etc.

If there was a method that could determine trend direction in real time without averaging historical prices or attempting to predict future price patterns, then at least one of the problems facing technical analysis (TA) would be resolved APAMI for metatrader 4/5 is a real-life example of how coincident price action can be observed and measured in practice. Attached pdf is the abstract for the whitepaper that explains how concurrent trends can be measured without the lag, guessing, or repainting.


There's still the 'problem' of what to do once the trend has been identified, but in my experience that is much more obvious once the trend direction is clear :D

What do you think of the possibilities of coincident price trends?

Coincident price trends is two line theory. It was first explored about the same time as Dow Theory.

Then as now, for you, you are focussing on the dependent valiable.

I will not interupt the thread further, but it is possible to develop and design using the connection between the independnet variable and the dependent variable.

Good luck
 
Quote from ybfjax:


What do you think of the possibilities of coincident price trends?

I gave examples of using this technique inside channels on this thread...

http://www.elitetrader.com/vb/showthread.php?s=&threadid=220303

As Jack says it is an old technique - it works. There was a guy wrote a book about it when he rediscovered the wheel (happens a lot in TA). I think he called it the New Elliot Wave or something like that. Anyway his theory was that when wave 2 is not the same length as wave 1, then W3 will be more like W1 and W4 will be like W2.

Enjoy your discovery :)
 
Quote from jack hershey:

Coincident price trends is two line theory. It was first explored about the same time as Dow Theory.

Then as now, for you, you are focussing on the dependent valiable.

I will not interupt the thread further, but it is possible to develop and design using the connection between the independnet variable and the dependent variable.

Good luck

Jack, could you go into more detail as to the 2 lines you are referring to. And the dependent / independent variables you are referring to?

The user must determine how to qualify the trend, but the core function of APAMI forces a pass/fail criteria to guarantee a higher-high/higher low (uptrend) and a lower high/lower low (downtrend).

I do understand if you would prefer to do it privately, as certain users may follow you here for other reasons than to contribute to the thread's topic :cool:

Quote from Xspurt:

I gave examples of using this technique inside channels on this thread...

http://www.elitetrader.com/vb/showthread.php?s=&threadid=220303

As Jack says it is an old technique - it works. There was a guy wrote a book about it when he rediscovered the wheel (happens a lot in TA). I think he called it the New Elliot Wave or something like that. Anyway his theory was that when wave 2 is not the same length as wave 1, then W3 will be more like W1 and W4 will be like W2.

Enjoy your discovery :)

I will take a look at the thread and advise later

The technique proposed in the whitepaper does not use hindsight. It is a linear, consistent, no-lag approach to determining a trend. Each trend detected, walking forward, is completely independent of each other. There is no additional patterns, unless the user wants to sprinkle on additional interpretation.

I don't think the wheel was reinvented. The fundamental truth behind it is not new; no truth is ever new, only old/new to the person bumping into it ;D But where else has this (coincident indicator) been done in financial markets, any platform (or at least metatrader as shown in the first post or whitepaper)? Everything I've seen on 'price action' is hindsight-based, or smoothed/predictive.
 
Measured moves. Sometimes it works profoundly well. Like exceptional, even off longer time frames. Worth pursuing to catch reversals with tight stops. Sometimes it doesn't work, at all.

And no, this method actually works (sometimes).

Check it out. The green lines are the exact same length. As are the yellow lines. Catching 100 pip moves.

35lgf3k.jpg
 
Quote from achilles28:

Measured moves. Sometimes it works profoundly well. Like exceptional, even off longer time frames. Worth pursuing to catch reversals with tight stops. Sometimes it doesn't work, at all.

And no, this method actually works (sometimes).

Check it out. The green lines are the exact same length. As are the yellow lines. Catching 100 pip moves.

...your uploaded photo....
I'm not familiar with the algorithm used in your measurement system, so i cannot comment except on what I see.

Not sure what you mean by "...Sometimes it works profoundly well....." The concept demonstrated in the APAMI whitepaper works every time, the same way, as long as the trading platform stays open with a real-time datafeed.

I noticed that the moves in your screenshot all start at the bottom/top of the bar. APAMI enforces the measurements rules tick-by-tick, and does not artificially pick tops and bottoms based on the high/low of the bar. moves can and often do start and finish intrabar. Actually, timeframe or type of chart has no impact on how APAMI calculates length. However, the user would want to use a larger timeframe like 30-60 min bars for longer moves (> 100.0 pips) and a smaller timeframe 1-15 min for smaller moves to make it visually easier to see the measurements across ticks and/or see the historical moves. Using a daily bar to measure 10 pip moves would result in visually having a lot of moves stacked on top of each other per day.

People would state things by hand.
 
"works every time"..... good luck with that....

if that were true you wouldn't be selling an indicator, or discussing it on a public message board, you'd be trading it.
 
Quote from ybfjax:

Jack, could you go into more detail as to the 2 lines you are referring to. And the dependent / independent variables you are referring to?

The user must determine how to qualify the trend, but the core function of APAMI forces a pass/fail criteria to guarantee a higher-high/higher low (uptrend) and a lower high/lower low (downtrend).

I do understand if you would prefer to do it privately, as certain users may follow you here for other reasons than to contribute to the thread's topic :cool:


Two line theory developed around oscillators and around absolute value rules sets.

And, thirdly people can use the cases in an extrodinary way.

There is a lot of text on the first two. When the PC came into use the original inventions lost synchronicty with market data. I corrected that by changing the inventor's defaults to the defaults currently in use today. You can differentiate who's who by their rate of adoption. Pring took four years.

Now for the meat of two line theory usage.

There are six cases. Personally, I named them as a consequence of file naming after I did the coding.

In market cycling, the cases follow an order. Simply stated any two line development allows a person to know the answers to the key questions for making money in any market; to wit:

1. Where is the market Now?

2. What is next? and

3. How fast is the market changing (event to event)?

Most people do not "get it" as to how the market operates. So they use two line theory "signals" instead. The above comment is a big bomb that blows up all quants.

The funniest example on ET was SPM of trader28 (long gone under that alias and 100 others). He chose the wrong two line indicator case and when I suggested he make his system profitable, he objected and continued his failure.

By using the 6 cases in their sequence, any person can trade any market by having "anticipation" and "sentiments" signals always at hand.

I did a two signal software on many levels of expertese. A guy named Bwolowski (sp) stole the beginner level and it was the top trading stuff on Fidelity for a while. It was called "CashCow" and happened as a consequence of a challenge. I was given a black and whilte chart of the independent varaible and asked to "call" the money making dependent variable. I did and I also pointed out when trading could not be done because the pit was closed.

Enough segway.

There are 11 cases in any market's independent variable.

Correspondingly, there are 10 cases in the dependent variable.

The difference is because of the space of representation.; no more no less.

There are some rather regal and elegant intellectual deductions possible. Fortunately, commonly, they are denied most minds.

Once I posted all these subtleties in one post and it was immediatly destoyed by a moderator. not only was I given a reprieve by my coding team (as a consequence of the moderator's action) but I learned to not try to fill a given person's head with pertinent facts.

To make money in markets, you have to get the variables straight. Volume is the independent variable. It is not debateable so people who know do not debate.

The format of volume takes half the variants off the table immediately. Anchoring is used. volume bars start at the "bottom" on an axis.

I invented a shadow that tells you immediately where the bar willl end in its forming over time: ProRataVolume (PRV). Even the lowliest can accept it as informative.

Elsewhere today I explained the most strong "signals" of volume in the sensory process of humans: peaks and troughs.

Now lets look at how a person make money sensing.

All he does is "always know that he knows". I will use the alphabet and a familiar process.

At first, a little person "sounds" out the letters and finds a word.

Imagine me "talking". I am using a language called "market operation". Your task is to write down what I say.

Your alphabet is in two subsets of 11 characters and 10 characters.

All sentences are constructed by having three words.

The language only has two sentences.

Two line theory was limited since it only had 6 cases.

By turning to the market's independent and dependent variables we get 21 cases and they are in synchronization.

We each have our support guys. So it is a ball all the time doing the cutting edge thing in the field.

I suggest to you that you use volume as the independent variable to tell you the answers to the three questions above.

You use the frame work of peaks and troughs to see and understand the bar-by-bar process to get from one place to another. You are doing sentences (trends) and you know there are two kinds of trends (long and short).

As you know Webster took over the words and a piano player took over the "punctuation".

In trend trading, I am the eternal "punctuator".

In the market operation language few peple speak it and most are bad bettors. But I worked personally with Dr. Suess to become the "punctuator. Justice Douglas calls me and my team the Green Mafia but I'm still the "punctuator" od the markets.

Here is the thing to behold. We have an alphabet of 21 charcters (a fifth grader can leanr this alphabet.) A lot of people fogured out a trend has three movements. They have two things each: a type of dominance and a type of sentiment. UP and Down are not part of trading. Movements go left to right or right to left.

Lets get back to being the PUNCTUATOR.

I made a rule. All sentences are punctuated at their ends.

A spanish sentence, if it is a question begins with a symbol that is turned right side up and ends with that symbol turned the other way.

Because the market operating language is so simple, I decided to really fuk it up with PUNCTUATION.

The mysterious punctuation rule that NO ONE ever wants me to give anyone else (after they "get it") is: you cant punctute until you have used up all the letters possible in a trend sentence. As a logician I know you and only you understand this.

A guy on ET is explaining stuff; but he can't punctuate after 30 years in the field. I saw a small person (petitish) give her first speech in his field. Denise blew it completely. Hitting things is not punctuating.

Dr Suess really turned me loose. Dr Braithwaite told me the same thing at BTL. There are 35 punctuation marks that end a trend. They had to be named since thay all have formulae and to keep the typed formula you have to make a file name.

as an experiment I gave marketsurfer the equation for the easiest one and asked him to only trade it so he could be a rich TA user. Here it is (new P1 -assigned P1) < (third P1 - newP1). this phrase is named PP1 and describes the brief trend (long or short) where the independent variable is accelerating while establishing itself as the beginning of a trend. It's punctuation on volume is a symbol at the top (or bottom) of a price bar that says REVERSE. As Denise wouldn't have it, it is red in color just to quell that feeling of taking profits.

So the punctuation (35) is used in 10 subsets which themselves are gated and then killed appropriately.

Bar-by-bar. letters appear in the right places. Then punctuation appears profit segment by profit segment.

Everything appears a little ahead of time. Nothing happens at the end of a bar.....Soooooo.... it must happen during the bar's formation.

I'm the PUNCTUATOR. lol....... I AM A LOGICOLIGIST.

for some of you, it is very important that you do NOT give your children books I write. The ETS thinks it is impossible for my students to wreck the math appitude test the way they do.......LOL The students love not using their appittude as a determinent when they tell the college that they may decide to go there.

 
Quote from jack hershey:

Quote from ybfjax:

Jack, could you go into more detail as to the 2 lines you are referring to. And the dependent / independent variables you are referring to?

The user must determine how to qualify the trend, but the core function of APAMI forces a pass/fail criteria to guarantee a higher-high/higher low (uptrend) and a lower high/lower low (downtrend).

I do understand if you would prefer to do it privately, as certain users may follow you here for other reasons than to contribute to the thread's topic :cool:


Two line theory developed around oscillators and around absolute value rules sets.

And, thirdly people can use the cases in an extrodinary way.

There is a lot of text on the first two. When the PC came into use the original inventions lost synchronicty with market data. I corrected that by changing the inventor's defaults to the defaults currently in use today. You can differentiate who's who by their rate of adoption. Pring took four years.

Now for the meat of two line theory usage.

...........

Interesting explanation of two line theory. I took a day to consider some parts of the 'meat' explanation. I don't think some of it applies to what Apami accomplishes. Apami only draws 1 line point-to-point, based on specific rules for higher highs/higher lows (uptrend) and lower lows/lower highs (downtrend) Up moves and down moves are independent of each other. There is no hindsight, and no forcing of a move to a bar's high or low (intra-bar moves are common).

i do know that sometimes people use different explanations and paths to arrive at the same conclusion. That's one of the reasons why systems are so important: to produce the same results regardless of who pushes the 'on' button.

You were also correct about the previous comment. Talk is cheap, so for some people it appears easier to make blanket assumptions than to review evidence and ask questions. The whitepaper abstract was a whopping 2.5 pages, with diagrams. Besides, a public message board is for...[pause][/pause]...public discussion :D
 
Back
Top