I created a document (attached to post) describing the platform I am currently building (C# .NET Core) to improve the process of finding profitable algorithmic strategies as described in the thread Removing the Golden Handcuffs.
Feedback appreciated.
New Approach for Testing Algorithmic Trading Strategies
Overview
The Problem
Typical algorithmic trading research platforms incorporate the paradigm of writing some code and then execute a backtest.
If (close > 50sma and close < lowerBollingerBand) then
Buy stock xyz
End if
In the above example, most platforms have the ability to optimize the indicator parameters in one process which does add time savings. The problem with this approach is it requires the user to manually code the construction of each strategy. Some platforms have built in Machine Learning capabilities but they are not always intuitive for users.
The Solution
Imagine we could wrap data relationships in components that implement a common interface. Imagine those data relationships could be defined as static (i.e. close > 50sma) or dynamic (i.e. close ? 50sma) which would be defined for each point in time. Imagine we could then instruct the platform how to test the various combination of components we are interested in. Let’s walk through an actual example and see the associated code. The platform is written C# .NET Core.
Note: The example below is very simple and only for demonstration purposes. Performance of strategies found via the code below would not be viable for live trading.
Example

Figure 1: Strategy Components
In Figure 1 above, note the variable higherTfsma200. This strategy component contains the data relationship between the close and the 200 sma of the target time frame (15 minute). Also note the Operator.LessThan value. This means the data relationship is static with close < 200 sma. Next, note the higherTfciv1 component. This strategy component uses a ChangeInValue indicator which is wrapped in the ChangeInValueConfiguration class (more on how that works later). Also note the Operator.Dynamic value. This indicates that the actual relationship will be determined for each point in time for the 15 minute time series. Next, note the higherTfciv2 component. The only difference between this component and the previous component is it will determine the ChangeInValue for the current close and the previous close where higherTfciv1 only determines the ChangeInValue for the current close.
Now that we have our strategy components, we are going to strategically assembly them in a Dictionary of ComponentConfiguration arrays. Note the construction of ccs (three keys of 0, 1, 2) and the requireKeys variable (0, 2). Each combination requires an element from the array at key 0 and 2 of the dictionary. There will only be one component per key in any combination. This will result in the following combination of these components.
higherTfsma200, targetTfciv1
higherTfsma200, targetTfciv2
higherTfsma200, targetTfciv1, higherTfciv1
higherTfsma200, targetTfciv1, higherTfciv2
higherTfsma200, targetTfciv2, higherTfciv1
higherTfsma200, targetTfciv2, higherTfciv2
For each of the component combinations above, the platform will go through each point in time in the data series and construct a strategy based on the components. If any of the data relationships that are not defined as Operator.Dynamic and are not true for that point in time, the strategy is not tested. The platform keeps track of which strategies it tests so as not to duplicate work.
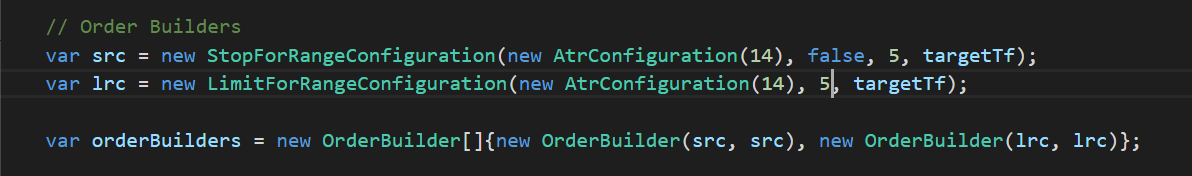
Figure 2: Order Builders
In Figure 2 we define the orders used in the backtest for each strategy. An OrderBuilder constructor takes two interface parameters which are IOrderConfigurator and IOrderDataRetriever which is implemented by the StopForRangeConfiguration and LimitForRangeConfiguration classes. By using publicly available interfaces, the users of the platform can easily extend the platform. More on that later. These two OrderBuilders will result in stop and limit orders that are 5 time the ATR value away from the entry price of the trade.
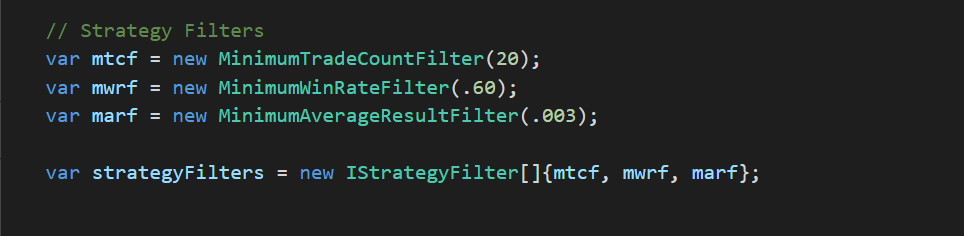
Figure 3: Strategy Filters
In Figure 3 we define three strategy filters to use. These filters will instruct the platform that we are only interested in strategies that have at least 20 trades, a minimum win rate of 60% and an average trade result of 3%. Strategy filters classes implement the IStrategyFilter interface so users of the platform can create their own strategy filters.
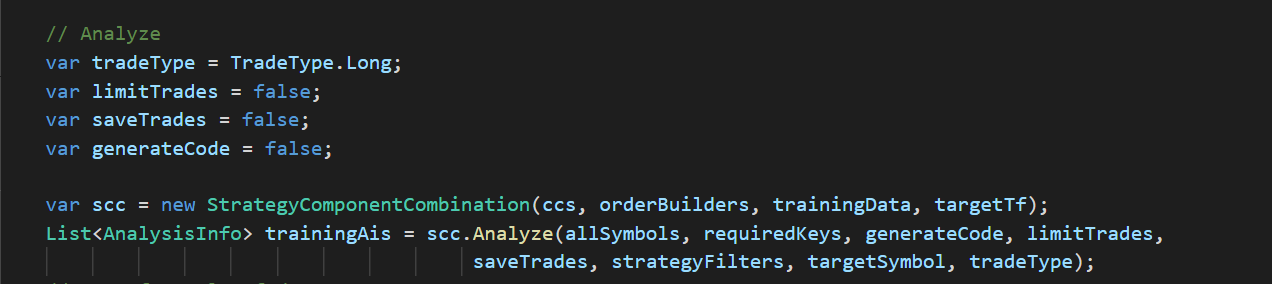
Figure 4: Analyze
In Figure 4, we instantiate the StrategyComponentCombination class and call its analyze method which will create strategies based on the targetSymbol data and test those strategies against that symbol and symbols in allSymbols. For now, we are only testing one symbol (ES). The limitTrades parameter indicates whether to take all signals or just one signal per symbol at a time (i.e. limitTrades = true means symbol XYZ would not have overlapping trades for a strategy). To save on memory, we have saveTrades and generateCode set to false because we do not need that information for strategies that do not need meet the filter criteria. The List<AnalysisInfo> collection will contain the definition and results of the strategies that passed the strategy filters.
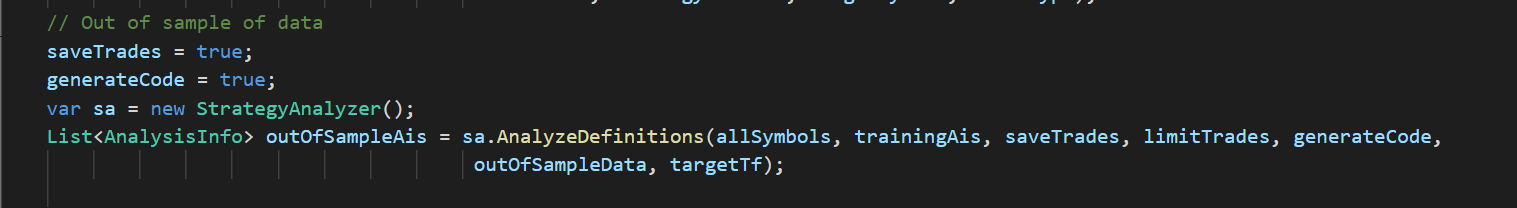
Figure 5: Analyze filtered strategies on out of sample data
In Figure 5, we backtest the strategies that passed the strategy filters on a new set of data. Here we have saveTrades and generateCode set to true as we will want to output this information.

Figure 6: Filter strategies test on out of sample data
In Figure 6, the strategies are explicitly filtered from the results of the out of sample backtest. The next step (not shown here) is to output the results for further analysis.

Figure 7: Actual execution of the preceding code
Figure 7 shows that out of the strategy component combinations, 1054 total strategies were generated and tested. Of those, 49 strategies ran against the training data passed the strategy filters and 4 of those 49 strategies passed the strategy filters on the out of sample data. The results were written to disc. The total time to execute was 29 seconds.

Figure 8: Order Optimization Code
In Figure 8, we now want to test various order combinations with our filtered strategies. We add our OrderBuilder arrays to a Dictionary and use the same concept of the Dictionary and requireKeys variable to instruct the platform how to combine the OrderBuilders for each strategy. The code above will result in 99 unique OrderBuilder combinations which are then tested against the filtered strategies.

Figure 9: Order Optimization Execution
Figure 9 shows the order optimization execution. 99 order combinations were tested for the filtered strategies on the complete data set (ES 2002 to 2012) in 19 seconds.

Figure 10: Result output of the filtered strategies written to disc
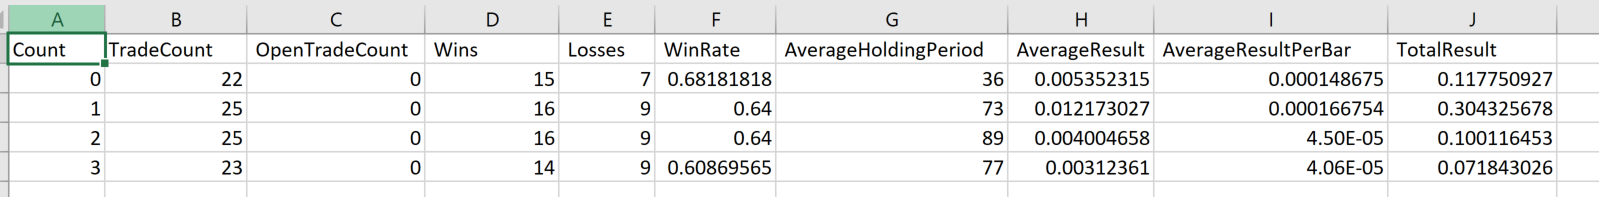
Figure 11: EdgeTestResults.csv content containing result metrics of the 4 filtered strategies

Figure 12: Code, results, trades and strategy definition data for one of the filtered strategies
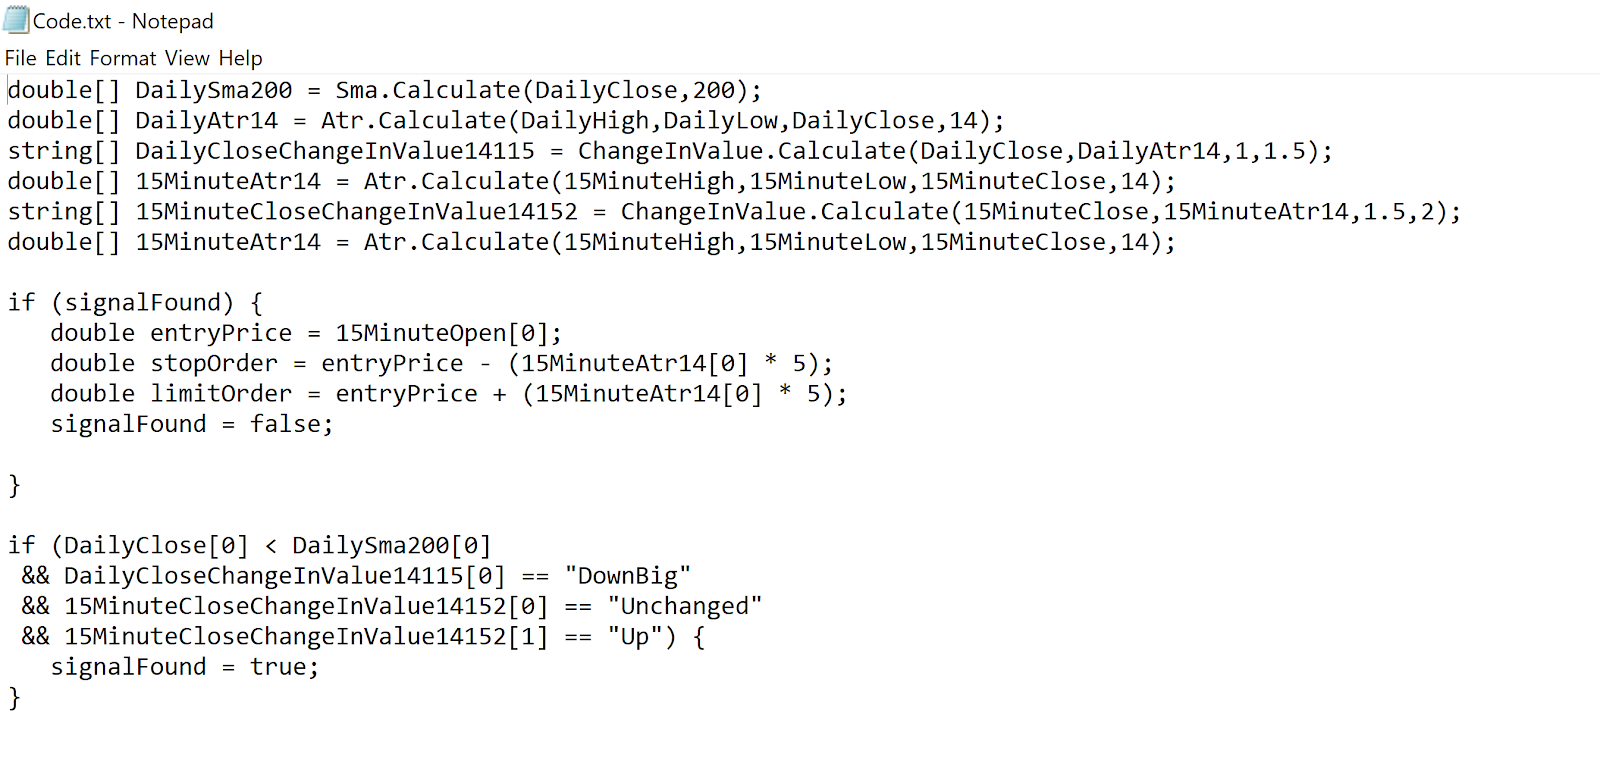
Figure 13: C#/Pseudo Code of one of the filtered strategy
Figure 13 shows code generated for one of the filtered strategies. This code as it is now will not compile but eventually will be able to compile in the targeted platform.
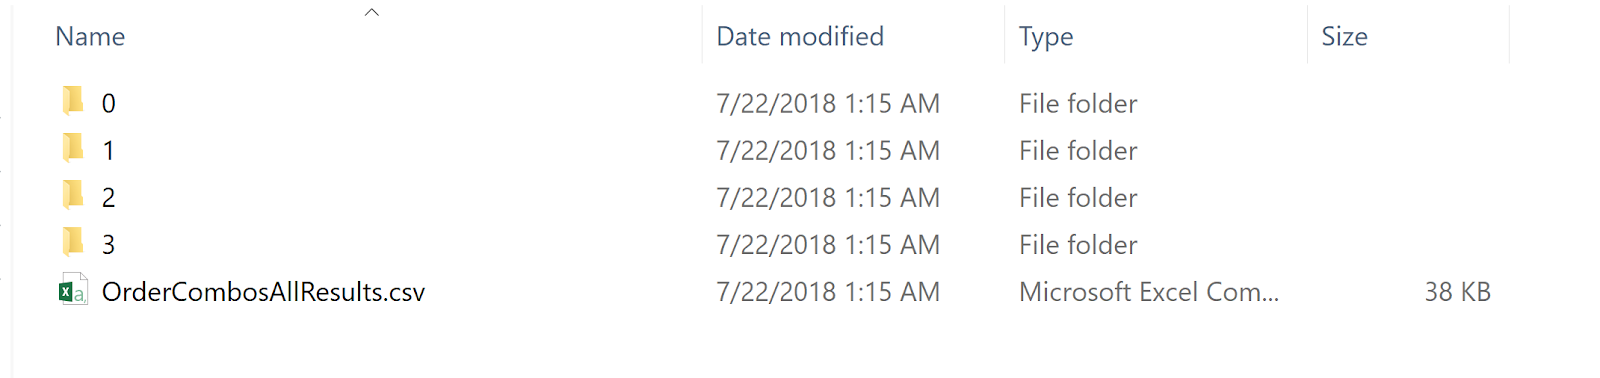
Figure 14: Contents of OrderCombos directory
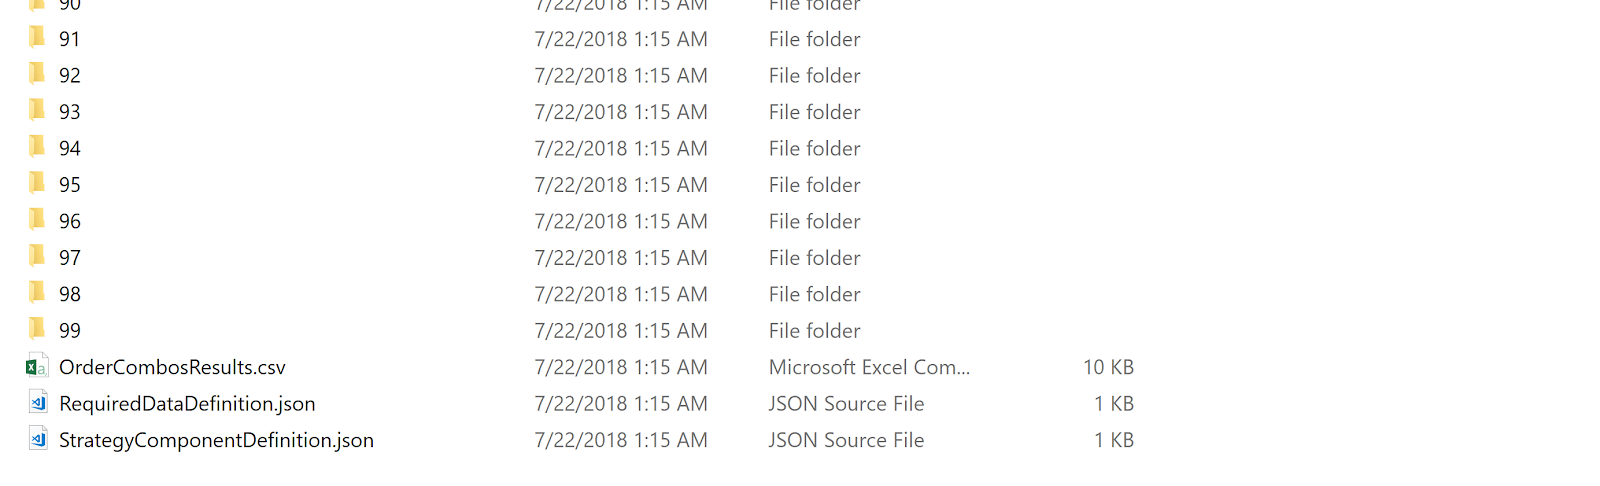
Figure 15: Contents of the directory containing the first filtered strategy and the output of all order combinations

Figure 16: Contents of OrderComboResults.csv containing results for all of the order combinations
Extending the Platform
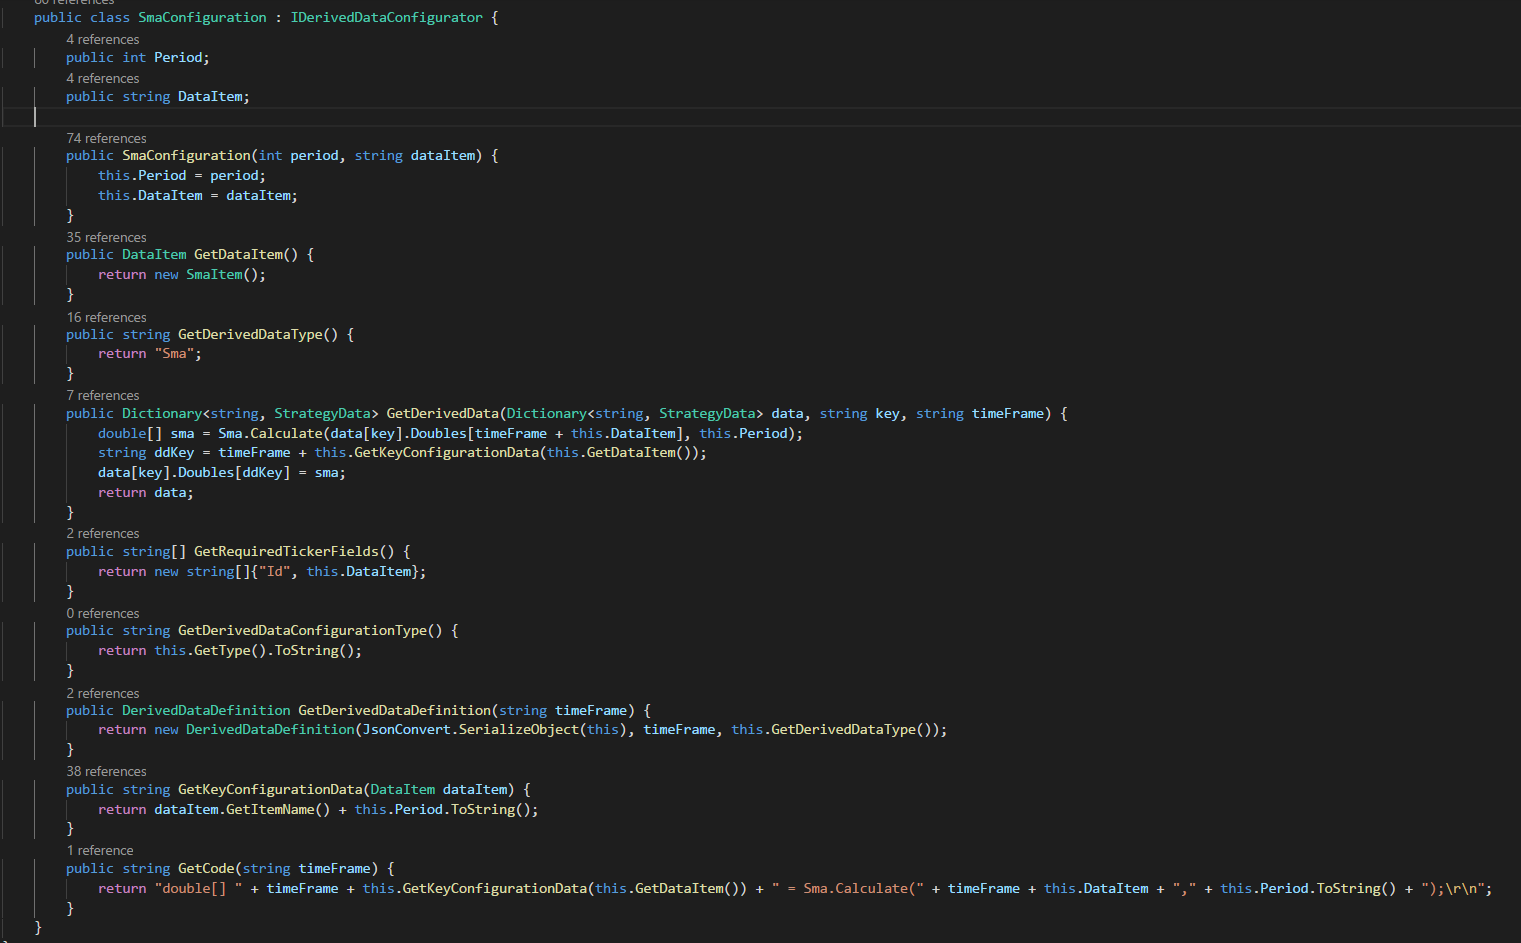
Figure 16: Class implementing IDerivedDataConfigurator interface
Figure 16 shows how to wrap indicator calls and resulting data to make available by the platform via the IDerivedDataConfigurator interface. See Figure 1 for a demonstration of how the SmaConfiguration class is used in a strategy component. The GetDerivedData method calls into the external indicator code and the GetCode method gets the code required to make a call to the indicator. For now, this is C# code but will eventually be a more general purpose format that can be consumed by interpreter classes which can generate code for other platforms.
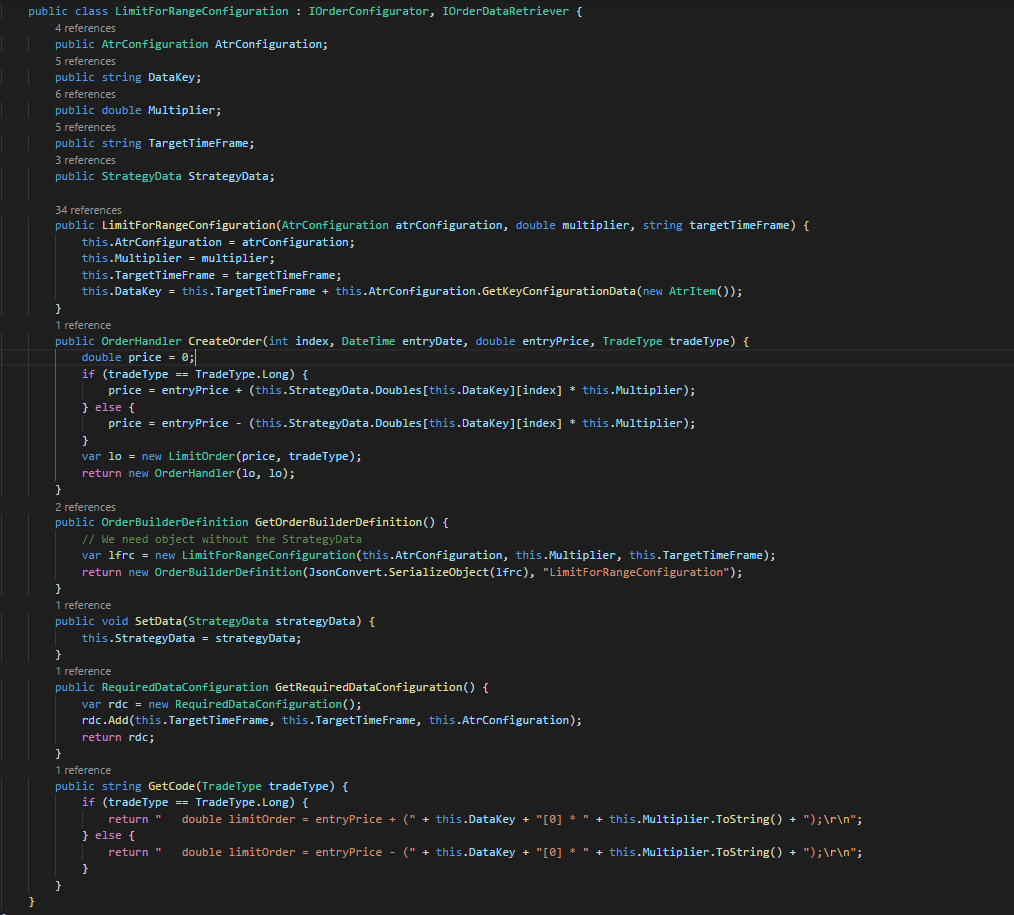
Figure 17: Class implementing IOrderConfigurator and IOrderDataRetriever interfaces
Figure 17 shows how users can create their own order logic via classes implementing the IOrderConfigurator and IOrderDataRetriever interfaces. See Figure 2 for an example of how the LimitForRangeConfiguration class is used to create and OrderBuilder.
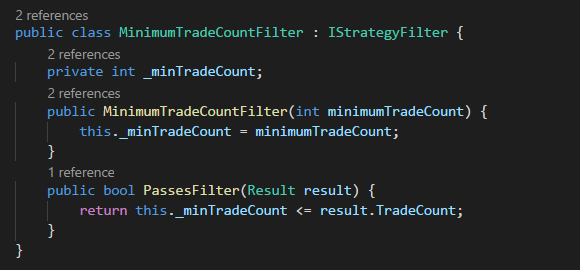
Figure 17: Class implementing the IStrategyFilter interface
Figure 17 shows the MinimumTradeCountFilter class implementing the IStrategyFilter interface. Users can easily create their own strategy filters as shown above.
Feedback appreciated.
New Approach for Testing Algorithmic Trading Strategies
Overview
The Problem
Typical algorithmic trading research platforms incorporate the paradigm of writing some code and then execute a backtest.
If (close > 50sma and close < lowerBollingerBand) then
Buy stock xyz
End if
In the above example, most platforms have the ability to optimize the indicator parameters in one process which does add time savings. The problem with this approach is it requires the user to manually code the construction of each strategy. Some platforms have built in Machine Learning capabilities but they are not always intuitive for users.
The Solution
Imagine we could wrap data relationships in components that implement a common interface. Imagine those data relationships could be defined as static (i.e. close > 50sma) or dynamic (i.e. close ? 50sma) which would be defined for each point in time. Imagine we could then instruct the platform how to test the various combination of components we are interested in. Let’s walk through an actual example and see the associated code. The platform is written C# .NET Core.
Note: The example below is very simple and only for demonstration purposes. Performance of strategies found via the code below would not be viable for live trading.
Example
Figure 1: Strategy Components
In Figure 1 above, note the variable higherTfsma200. This strategy component contains the data relationship between the close and the 200 sma of the target time frame (15 minute). Also note the Operator.LessThan value. This means the data relationship is static with close < 200 sma. Next, note the higherTfciv1 component. This strategy component uses a ChangeInValue indicator which is wrapped in the ChangeInValueConfiguration class (more on how that works later). Also note the Operator.Dynamic value. This indicates that the actual relationship will be determined for each point in time for the 15 minute time series. Next, note the higherTfciv2 component. The only difference between this component and the previous component is it will determine the ChangeInValue for the current close and the previous close where higherTfciv1 only determines the ChangeInValue for the current close.
Now that we have our strategy components, we are going to strategically assembly them in a Dictionary of ComponentConfiguration arrays. Note the construction of ccs (three keys of 0, 1, 2) and the requireKeys variable (0, 2). Each combination requires an element from the array at key 0 and 2 of the dictionary. There will only be one component per key in any combination. This will result in the following combination of these components.
higherTfsma200, targetTfciv1
higherTfsma200, targetTfciv2
higherTfsma200, targetTfciv1, higherTfciv1
higherTfsma200, targetTfciv1, higherTfciv2
higherTfsma200, targetTfciv2, higherTfciv1
higherTfsma200, targetTfciv2, higherTfciv2
For each of the component combinations above, the platform will go through each point in time in the data series and construct a strategy based on the components. If any of the data relationships that are not defined as Operator.Dynamic and are not true for that point in time, the strategy is not tested. The platform keeps track of which strategies it tests so as not to duplicate work.
Figure 2: Order Builders
In Figure 2 we define the orders used in the backtest for each strategy. An OrderBuilder constructor takes two interface parameters which are IOrderConfigurator and IOrderDataRetriever which is implemented by the StopForRangeConfiguration and LimitForRangeConfiguration classes. By using publicly available interfaces, the users of the platform can easily extend the platform. More on that later. These two OrderBuilders will result in stop and limit orders that are 5 time the ATR value away from the entry price of the trade.
Figure 3: Strategy Filters
In Figure 3 we define three strategy filters to use. These filters will instruct the platform that we are only interested in strategies that have at least 20 trades, a minimum win rate of 60% and an average trade result of 3%. Strategy filters classes implement the IStrategyFilter interface so users of the platform can create their own strategy filters.
Figure 4: Analyze
In Figure 4, we instantiate the StrategyComponentCombination class and call its analyze method which will create strategies based on the targetSymbol data and test those strategies against that symbol and symbols in allSymbols. For now, we are only testing one symbol (ES). The limitTrades parameter indicates whether to take all signals or just one signal per symbol at a time (i.e. limitTrades = true means symbol XYZ would not have overlapping trades for a strategy). To save on memory, we have saveTrades and generateCode set to false because we do not need that information for strategies that do not need meet the filter criteria. The List<AnalysisInfo> collection will contain the definition and results of the strategies that passed the strategy filters.
Figure 5: Analyze filtered strategies on out of sample data
In Figure 5, we backtest the strategies that passed the strategy filters on a new set of data. Here we have saveTrades and generateCode set to true as we will want to output this information.
Figure 6: Filter strategies test on out of sample data
In Figure 6, the strategies are explicitly filtered from the results of the out of sample backtest. The next step (not shown here) is to output the results for further analysis.
Figure 7: Actual execution of the preceding code
Figure 7 shows that out of the strategy component combinations, 1054 total strategies were generated and tested. Of those, 49 strategies ran against the training data passed the strategy filters and 4 of those 49 strategies passed the strategy filters on the out of sample data. The results were written to disc. The total time to execute was 29 seconds.
Figure 8: Order Optimization Code
In Figure 8, we now want to test various order combinations with our filtered strategies. We add our OrderBuilder arrays to a Dictionary and use the same concept of the Dictionary and requireKeys variable to instruct the platform how to combine the OrderBuilders for each strategy. The code above will result in 99 unique OrderBuilder combinations which are then tested against the filtered strategies.
Figure 9: Order Optimization Execution
Figure 9 shows the order optimization execution. 99 order combinations were tested for the filtered strategies on the complete data set (ES 2002 to 2012) in 19 seconds.
Figure 10: Result output of the filtered strategies written to disc
Figure 11: EdgeTestResults.csv content containing result metrics of the 4 filtered strategies
Figure 12: Code, results, trades and strategy definition data for one of the filtered strategies
Figure 13: C#/Pseudo Code of one of the filtered strategy
Figure 13 shows code generated for one of the filtered strategies. This code as it is now will not compile but eventually will be able to compile in the targeted platform.
Figure 14: Contents of OrderCombos directory
Figure 15: Contents of the directory containing the first filtered strategy and the output of all order combinations
Figure 16: Contents of OrderComboResults.csv containing results for all of the order combinations
Extending the Platform
Figure 16: Class implementing IDerivedDataConfigurator interface
Figure 16 shows how to wrap indicator calls and resulting data to make available by the platform via the IDerivedDataConfigurator interface. See Figure 1 for a demonstration of how the SmaConfiguration class is used in a strategy component. The GetDerivedData method calls into the external indicator code and the GetCode method gets the code required to make a call to the indicator. For now, this is C# code but will eventually be a more general purpose format that can be consumed by interpreter classes which can generate code for other platforms.
Figure 17: Class implementing IOrderConfigurator and IOrderDataRetriever interfaces
Figure 17 shows how users can create their own order logic via classes implementing the IOrderConfigurator and IOrderDataRetriever interfaces. See Figure 2 for an example of how the LimitForRangeConfiguration class is used to create and OrderBuilder.
Figure 17: Class implementing the IStrategyFilter interface
Figure 17 shows the MinimumTradeCountFilter class implementing the IStrategyFilter interface. Users can easily create their own strategy filters as shown above.
Attachments
Last edited: