You are using an out of date browser. It may not display this or other websites correctly.
You should upgrade or use an alternative browser.
You should upgrade or use an alternative browser.
Need help coding Jh volume indicator for esignal
- Thread starter Learning_SCT
- Start date
- Status
- Not open for further replies.
dear jack or anyone else
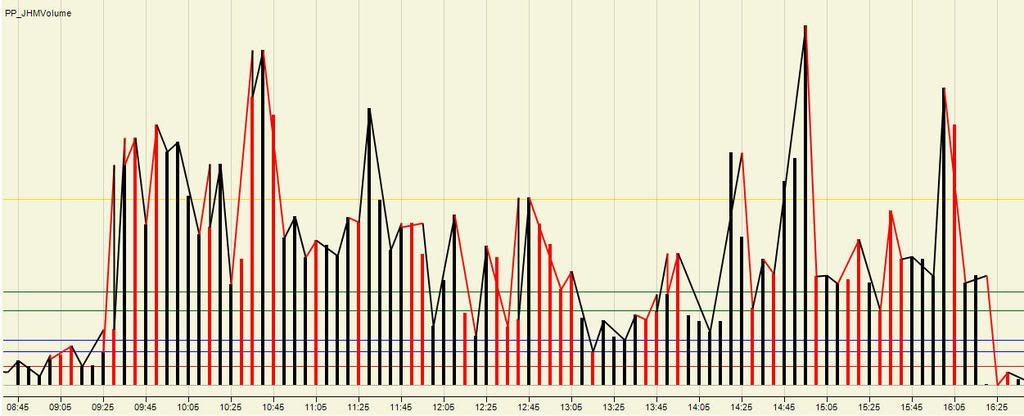
can someone give me a quick rundown on how to draw these gaussians on the volume like on this chart.
thank you
can someone give me a quick rundown on how to draw these gaussians on the volume like on this chart.
thank you
so far this is how i understand the gaussian lines.
in a uptrend, if the prices are heading up, and the volume is either increasing or stable, we draw a black gaussian with a positive slope (pointing up)
then if we get a retracement, with decreasing or stable volume, we draw a red gaussian sloping down.
when we get a downmove with increasing volume, we draw a red gaussian pointing up, and then when there is a retracement in the downmove, we draw a black gaussian sloping down.
r2r and b2b fomations are basically potential reversal points. i believe this is where the ''MACD and STOCH makes good helpers'' thread from jack comes into play.
i swear the gods guys, i read the entire jack hershey PRV SCT thousand pages long threads, twice, but i still miss some information.
jack or spyder or anyone knowing the answer, can you please help me? i'm really willing to devote a lot of energy in this, but i need assistance of a more knowledgeable person on the subject than me.
Check the first month of last year's futures journal. There is a detailed discussion there.Quote from Learning_SCT:
so far this is how i understand the gaussian lines.
...
i swear the gods guys, i read the entire jack hershey PRV SCT thousand pages long threads, twice, but i still miss some information.
http://www.elitetrader.com/vb/showthread.php?s=&threadid=83604&perpage=6&pagenumber=1
tips and tricks:
go to the first page of the journal, change the URL to &perpage=40 (that's the max).
Use your browser's "find" function to highlight all the "gaussian" keyword.
or
press the "Print" button at the top right corner of the page. It will covert the whole thread into a text document. (it will take some time because this is a long thread.)
You can save the doc to your computer and then it will make searching of your keyword easier.
No personal attacks.
Quote from jack hershey:
The six levels of skill and knowledge are each served with a complete set of modules. As expected, the complex of modules feed upward from one level to the next. At the summit, all that is offered is extracted. As has been shown the algoirthm applied to three systems: PVT, SCT and sector rotation. We find that is has been a worthy goal to make it all workable in any market on any fractal anywhere in the world where sufficient liquidity exists.
Jack,
Couldn't find much discussion on sector rotation, just mention of it in passing. From what I gather it's not trading sector funds as the term might imply. But using the template on the sectors, to position trade stocks within those sectors. Is that correct? Are there plans to cover this at some point?
Regards - EZ
Well, if I've been conditioned to look at things from more than one point of view, I am certainly happy that it happened! It's a valuable thing, financially valuable for a trader. If everyone were conditioned like that, they could consider themselves somewhat educated.Quote from jack hershey:
I am an amateur so I do not concern myself with what is primarily on your mind by the conditioning you have been subjected too.
Quote from jack hershey:
This is the P, V module:

Here you see the P and V modules come in as information (the horizontal input to a module is always information, facts that are certain)
this module outputs the extremely important trading analysis results on :
the mode; internals; and pace change
To get the certain outputs, a vertical input is needed. This formula is in base 2 and only takes certain infoprmation and only outputs certain information.
Jack,
Would you elaborate on the 'Pace change over-rider' and it's logic application in use or storage?
I know the importance of pace and how money velocity is directly related to pace. But from a programmability perspective (i.e. the cases, channels, PRV and jokari are programmable) I am unsure I am grasping all of your intent on the over-rider... am I missing something here?
Thanks for any additional clarity.
Quote from ehorn:
So as I think on this a bit more, what I am coming up with is the following... But I am not confident it is what was intended or the track I should be focused on?
From a programming point of view (and also monitoring), the question seems to be, how do you differentiate between volume change within the Jokari window and pace change (thus of the whole window), on a bar to bar basis?
But the 'internals detector' seems to refer to something else ... unless it's what you use to determine pace change.
-palinuro
- Status
- Not open for further replies.