Navigating the market in times of high volatility

Matt_ORATS

Sponsor
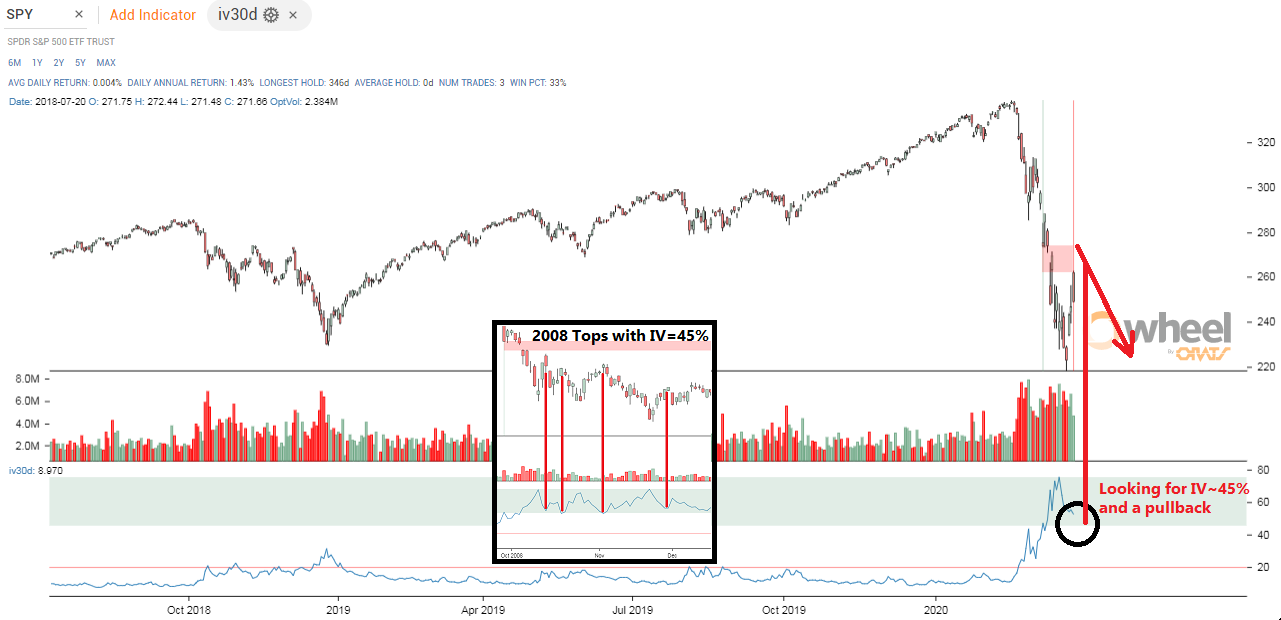
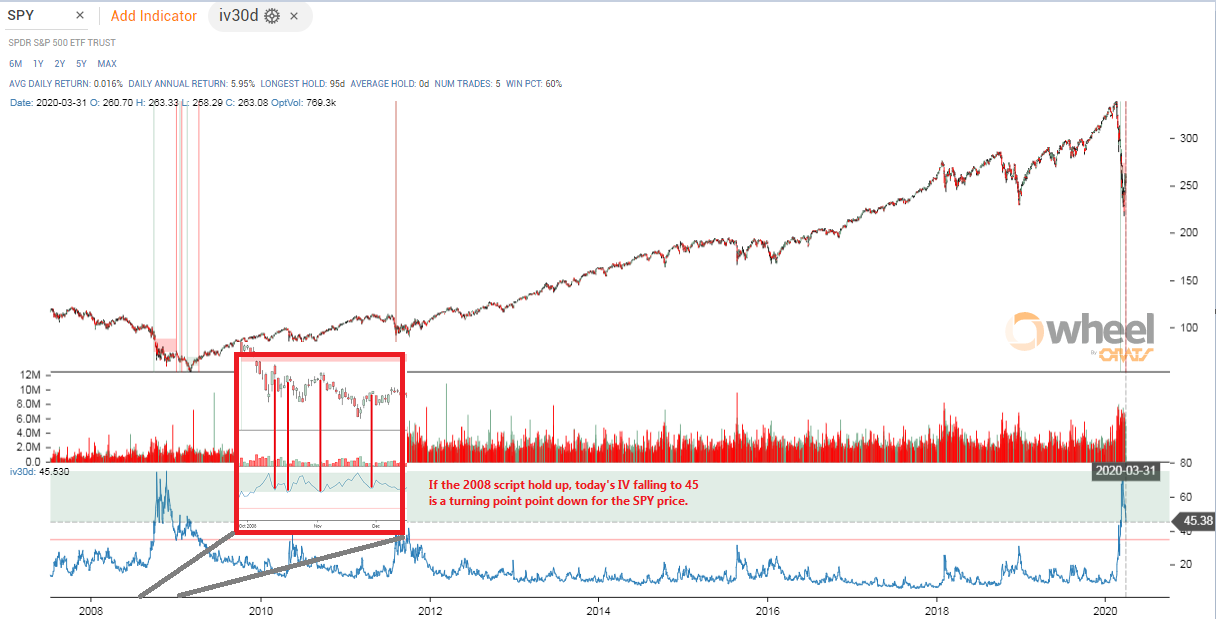
The last time vol was this high in 2008, the SPY implied volatility at 30 days bounced between 45% and 75%. These extremes coincided with market tops and bottoms respectively. SPY IV is currently 51% coming down from 75% on 3/18/20.

Access this graph for free here: https://wheel.orats.com/

SPY2008iv.png
 
Make sure if USA index's or stocks you don't hit limit up or down, then expose yourself to a gap situation, middle range you can play, but don't hold a downtrend or up trend to new lows/highs cause ouch that could SUCK!!

Side on the sidelines here, DAX at times looks like a good risk, upside amazing, but downside just too scarey.

Wait for calm times is my advice.
 
The VIX settling unchanged at 61%+ on the biggest one day rally in history for the DOW is an ominous sign, and tells you that the bottom is not in yet. Peak-to-trough SPX correction in 2008-2009 was over 50%. We need to see 1700 (-50% from Feb 19 highs) in the S&P 500 and a new all-time high in the VIX 90%-100% before we can finally call the bottom.
 
Vol of vol clusters, these moves are historic, and sadly the markets algorithms are giving us a glimpse of how they can move now in this new decade. The velocity is rapid, so much so, the spreads can’t get tight.

Look at a 6 month chart of some single names like COST, MMM, FB, NFLX, JNJ, PEP, NKE etc etc, look at the magnitude of the ATR, and notice price barely moved really. This is very odd looking man. And I’ve been trading these single names, everytime I buy premium (especially puts) I’m banking some coin. But these are one lots and Im fully liquid now. I don’t know how to navigate thru this market. But it’s a great learning experience.
 
Back
Top