TrendSpider_Jake
Sponsor
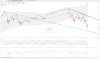
Using multiple time frames is the best way to get the full picture with what is really going on with a stock. The TrendSpider platform allows users to overlay longer-term Fib levels, trendlines, upper indicators, and lower indicators to shorter-term timeframes. This example shows the daily SPY chart with the weekly trendline overlay (dashed line) and weekly Bollinger Band (dashed as well).