You are using an out of date browser. It may not display this or other websites correctly.
You should upgrade or use an alternative browser.
You should upgrade or use an alternative browser.
Moving Averages discussion
- Thread starter traderking007
- Start date

I use ToS. Looks like I can chart MNQ if you mean this Micro Nasdaq 100 Index, and M2K appears as well, how come? What should I be looking for there?Can you chart MNQ or M2K data on your 1m, 5m charts?
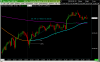
If you feel like it sometime, no rush, post an image of MNQ 1m chart that shows 9:20 AM to around 11:AM, and another that shows 1:30 PM to around 3:35 PM, and maybe one that shows 8:00 PM to 10:30 PM.ToS
If you wanted to put a 200MA and 50MA on there that'd be cool. If you happened to put daily pivots on there, all the better, lol.
Thanks Kroxobor, so far I've been using a 9 EMA and 25 SMA with the 200 SMA there just to keep my bearings. What I don't understand yet is what happens when you examine those from different timeframes: say 1 min, vs 1 hour or longer. Seems to change how you should interpret the signals, but I have no idea how yet.
Something I do that I find helpful, I put the 15m and 5m EMA on the 1m chart. That way I know when I am approaching those MAs without having to keep track of MAs on three different charts. I only have one display panel, but I would still do that with a multi-panel setup.
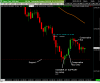
Here's the first one from today, 9:20 to 11. Blue line is 50 SMA, White is 200 SMA. Not sure how to add pivot points yet, the arrows are just set to engulfing candles.If you feel like it sometime, no rush, post an image of MNQ 1m chart that shows 9:20 AM to around 11:AM, and another that shows 1:30 PM to around 3:35 PM, and maybe one that shows 8:00 PM to 10:30 PM.
If you wanted to put a 200MA and 50MA on there that'd be cool. If you happened to put daily pivots on there, all the better, lol.
Attachments
Hm, I'll give that a try. Right now I'm one chart setup too, hopping back and forth between 1m and 5m also freezes my decision-making. I need a much bigger screen, maybe two. Still clueless on how to drill down thru timeframes.Something I do that I find helpful, I put the 15m and 5m EMA on the 1m chart. That way I know when I am approaching those MAs without having to keep track of MAs on three different charts. I only have one display panel, but I would still do that with a multi-panel setup.
Can the arrows be set for Hammers?Here's the first one from today, 9:20 to 11. Blue line is 50 SMA, White is 200 SMA. Not sure how to add pivot points yet, the arrows are just set to engulfing candles.
Don't forget the AT SUPPORT, AT RESISTANCE clause, a most important aspect imho. Moving averages of all stripes can serve this function I suppose, 50, 200sma, 30wma, your choices likely work fine too, so shop around. Moving averages, while convenient, are by no means the only way to work S/R levels. This search has returns pointing that out. https://yippy.com/search?query=AT+SUPPORT,+AT+RESISTANCE
Engulfings likewise share entry trigger function with HAMMERS AT SUP RES, which occur in opportune situations more often in my experience.
Whether you decide to trade MNQ 1 - 5 minute charts, (low margin, good liquidity, easily scalable position $izing) they are a good way to look at the behavior of this and other setups on a devious product full of twists and turns. Stocks can gap enough overnight to bring another layer of complexity into using mov avgs for sup res. Ideas and info on this angle might be good.
Fwiw, this method relies on at support, at resistance. Moving averages are a good way to start to explore this method because they objectively draw themselves. At the other end of the spectrum you got your trendlines, a subject of much controversy, yet you can find some lucrative situations get highlighted this way too. This is where a simple spreadsheet to track your findings will be valuable. ET threads opine on what is useful to track. Start small, make it easy, Setup, Trigger, P/L, ...eg. At Support Trendline, Hammer, 57 ticks, aud https://elitetrader.com/et/threads/analysis-and-signal.340008/page-9#post-5222703
Last edited:
While you decide, remember that thrift stores, craigslist... have dell 19" flatscreens and the like for $14. https://elitetrader.com/et/threads/...34-up-to-49-screens-vs-multi-monitors.350484/I need a much bigger screen, maybe two.
Read my mind, thinking I'll get a Dell. I've been doing all this on my macbook and I'm just getting sick of squinting. I'm a bit older to be so new to trading, I know my eyes will thank me for getting a nice 27" screen.