
You are using an out of date browser. It may not display this or other websites correctly.
You should upgrade or use an alternative browser.
You should upgrade or use an alternative browser.
Moment-by-Moment (MbM) Trading strategy
- Thread starter rajesheck
- Start date

"Step #1
Current volatility must be at least 0.4% approximately."
Hi, rajesheck
Could you exlplain 0.4% volatility,what is it?0.4% of what?
For example if the index script is trading at 9000 points. Then 0.4% volatility means 36 points (9000 X 0.4 / 100 ).
For example if the index script is trading at 9000 points. Then 0.4% volatility means 36 points (9000 X 0.4 / 100 ).
I don`t get it at all.What is the index script?In the image you`ve posted there are the arrows pointed to the high/low of the trend segment.I thought it was the measure of the move.
I don`t get it at all.What is the index script?In the image you`ve posted there are the arrows pointed to the high/low of the trend segment.I thought it was the measure of the move.
This strategy works best for primary index than stock or sector index.
The "current volatility" means either day's volatility or the current range's volatility, not the current movement. If price is stuck within a range (which may be a subset of the day's volatility) then the current range volatility must be at least 0.4%. Otherwise the day's volatility must be be at least 0.4%.
The arrows points to the "two consequent resistances", not high / lows.
Last edited:
This strategy works best for primary index than stock or sector index.
The "current volatility" means either day's volatility or the current range's volatility, not the current movement. If price is stuck within a range (which may be a subset of the day's volatility) then the current range volatility must be at least 0.4%. Otherwise the day's volatility must be be at least 0.4%.
The arrows points to the "two consequent resistances", not high / lows.
So the range between the aroows must be calculated by this formula:
(N X 0.4 / 100 )?
What time frame?
Another question, if i may ask.Would you please post a Demo chart with the range situation, with entries?
Thanks
So the range between the aroows must be calculated by this formula:
(N X 0.4 / 100 )?
What time frame?
Another question, if i may ask.Would you please post a Demo chart with the range situation, with entries?
Thanks
Yes.
One minute time frame is best if the 0.4% minimum volatility rule is strictly followed.
I can respond to charts posted by others.
Last edited:
Yes.
One minute time frame is best if the 0.4% minimum volatility rule is strictly followed.
I can respond to charts posted by others.
Ok.here`s the current euro futures chart.The formula`s range is ~ 50 points(1.148*0.4/100 = 0.00459).
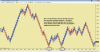
Ok.here`s the current euro futures chart.The formula`s range is ~ 50 points(1.148*0.4/100 = 0.00459).View attachment 175393 The actual range of the window is 100 points.Is the entry eligible?
A good looking chart of bullish trend. There is one more support before those two you marked. For a valid entry the second support level in the sequence must be well above first support level. The first and second supports were on the same level. So they it is not an entry. The second and third supports were also on the same level. So no valid entry again.
There is a valid entry here on the second support level marked by a green candle. However the red candle marks the exit to avoid a possible loss. The momentum has failed and most probably this wont take off as expected. This is emergency exit. Our first preference is to avoid loss. Profit making is on our second priority.
A normal exit for a bullish trend would be on the second consequent resistance, mostly happens to be a profit booking. This strategy has a high success rate for takeoff.
Thanks for posting this chart. It has very important lessons in it.

A normal exit for a bullish trend would be on the second consequent resistance, mostly happens to be a profit booking. This strategy has a high success rate for takeoff.
Thanks for posting this chart. It has very important lessons in it.
Last edited: