Hi Bobiz. I am adding two different versions of the same instrument together.
To make it look like mine--
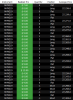
1) Add the normal prices to a blank chart. I use Line On Close for this chart. Using ESZ9 for this example.
View attachment 209098
2) Add the Cumulative Delta chart to the same chart. Also Line On Close, but a different color.
After step 1, highlight the chart and hit "Insert > Instrument." Select ESZ9. Click on Settings and click "Show Delta" at the bottom (and make sure "Cumulative Delta" type is selected):
View attachment 209096
3) Then on the Scaling tab, highlight "
Screen," then make sure "
Overlay Data Series" checked.
View attachment 209097
4) After all the correct selections, hit OK at the bottom right. This is what you get:
View attachment 209099
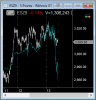
5) Now simply DRAG the bottom price line on top of the top priceline:
View attachment 209100
Important observations:
Set up like this, the CDelta chart will always be touching the high and the low of the screen. The numbers on the right are only for the real prices, and the CDelta chart is only relative to the high and low within the time-frame you are showing.
The moment you change the scaling on the chart, the CDelta will look very different. So it takes time to get used to things.
I watch all 4 main indicies trying to see relative strength and weakness.
View attachment 209102
The Cumulative Delta is often WRONG, but it is
right more than it is wrong.
The moves up or down in CDelta are USUALLY reflected in prices 1 to 15 minutes later, depending on the time frame you are using.
I rarely take the CDelta buying and selling aggression as the true future move, but if I see CDelta going down, I will NOT buy (for example), so more than anything, it
keeps me out of bad trades.
Let me know if you need more help with this.
p.s. Referencing my 4 charts above, notice the BIG move down in CDelta on ES and YM at the end of the day on Friday? HMMMM. This gets me thinking "short on pops" the next day.