Quote from Covertibility:
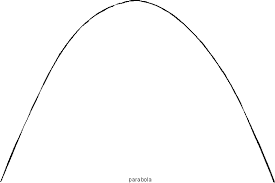
Let's say the x-axis is the tax rate. The Y-axis is revenue*.
At the apex of the parabola is the point where revenue is at its greatest.
Let's start anywhere to the left of the apex. By moving rightward toward the apex, the tax rate is increasing. You'll also see that by moving rightward, you're moving upward on the y-axis meaning revenues are going up.
The reverse will hold true. Start anywhere to the right of the apex. By moving leftward, tax rates fall but revenues increase.
So depending on which side of the apex you're located, increasing and decreasing taxes can generate more revenue.
*Revenue as a percentage of GDP.
More like :Let's say taxes (x-axis) really start at the apex of y . The Y-axis is the economy*.
The whole left of the apex doesn't exist because no level of taxation "makes" nor corresponds to higher growth in the economy.
Yeah, I know you didn't get that and my only economics class was home ec in the 9th* grade.
