Yes, that looks right.
Make this refinement
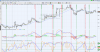
Put the 50 line on the 5,2,3
Put the 20,80 line on the 14,1,3
Now, go back a period of time to start. Every time the 5,2,3 crosses the 50, place a vertical line. If it's dropping from the top panel to the bottom panel have the line be red.
If it's rising from the bottom panel to the top have the line be green.
Doing this on the signal line is an earlier entry than doing this on the stoch line. Just pick one and be consistent.
Next, look at the 14,1,3
Do the same vertical lines but with this one do it AFTER the placement of the entry signal. Where this gets placed is when the Stoch line EXITS the overbought and oversold region of the 20,80 lines.
In other words, 5,2,3 crosses the 50 from the lower region, place vertical green line (entry). If this move continues to be dominant, than look at the 14,1,3 and (hold) until it exits the overbought region of the 80 line. (exit)
Then the 5,2,3 crosses the 50 from the upper region, place red vertical line (entry). If this move continues to be dominant than look at the 14,1,3 and (hold) until it exits the oversold region of the 20 line. (exit)
Next go through from your starting point, log bar-by-bar. If you are not trading intraday, use the 30min. If intraday then the 5min.
Fill in your log.
Print chart and log, messy is ok. Notice what you notice. Log questions that come up as well as insights deduced. Put this in a 3-ring binder. This will build your long term memory as well as providing a never-ending resource to build a solid foundation upon.
Post the chart and log.
Next we look at the MACD.
")