Medium Term Trading of SP500 with Cycle Analysis

  • Thread starter Thread starter SPX Blaster
  • Start date Start date
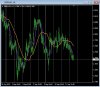
Still in gbpaud short. Now cooperating. Cycle points down to the end of the week.

forum1.jpg
forum.jpg
 
Gbpaud short doing better now. Next week, looking to short SP500. Need to confirm price high has been made. Will something happen that will cause it to sell off? Take a wait and see approach.

sp500  + marked.jpg
 
Closed gbpaud for decent profit. Now long usdcad due to cycle analysis, and it looks to be making a bottom now.

Clipboard02.jpg
usdcad 24+ marked.jpg
 

Attachments

  • Clipboard01.jpg
    Clipboard01.jpg
    61.1 KB · Views: 12
I was able to put stop loss a few pips above breakeven, and my limit profit order did not get hit, and I got out with a very small gain when price pulled back. It's Dragee's fault.
 
New forex trade idea in euraud. I have cycle charts of audchf, which is exactly inverse to euraud. The cycle chart displayed is of audchf, and I have inverted the turn points because I'm looking to trade euraud, not audchf. Looking at the euraud, it appears a bottom is in with high probablity. Euraud is expected to move higher till the cycle high due about Sep. 19. I am looking to go long and hope there may be some retrace to get a better entry price.

Clipboard01.jpg
 
If anyone is interested, you can start a private thread with me. I'm no longer going to post publicly.
 
Gbpaud short doing better now. Next week, looking to short SP500. Need to confirm price high has been made. Will something happen that will cause it to sell off? Take a wait and see approach.

View attachment 208893
Looks quite possible for a stock sell off. I will be posting very little here from now on. Only occasionally to bump the thread up. My email is in my profile if you wish to contact me and receive my cycle analysis. I do this on many different markets.
 
Well, I'm back to posting. Here is cycle analysis of nzdusd. Looks real good and serious coin could be made on it.

nzdusd cycle.jpg
 
Here's my cycle chart if the USD index. It suggests USD will strengthen this week. The vertical line represents the date of Sep. 14, or last Saturday.


usdx.jpg
 
This post attachment shows most all my cycle analysis charts for the current lunar month. It is not perfect, but may give an edge in trading as this is actually predicting future market direction. It does not tell you how far a market will move, but only approximately when. If your a trader who holds trades for a few days, this may be of interest to you.
If you cannot see the whole chart clearly, look in my profile and email me and I will send this to you through email. View in Windows paint program. I just now noticed if you click on the image, it zooms in and is easy to read then.

16 forum.jpg
 
Back
Top