Hey guys, new ET sponsor here, thought I would start a trading journal as a good way to demonstrate my custom indicators and trading strategy in action and create a swing trading community where we can all interact and share. If you like charts and technical analysis then this should be of interest to you.
I’m not claiming to be a market wizard or selling the holy grail to trading or anything like that, just offering a place where those interested can follow along and possibly find value.
I created the Buy Sell Bands and Range Strength custom indicators as a plugin on the TradingView charting platform that anybody can use and that once installed automatically shows on every chart and timeframe you look at, together with these custom indicators I also offer a private members area on my website with trading strategy videos and other resources that you can use the Buy Sell Bands with, I'm also happy to do my best to provide support and help any traders with any problems they may be having.
I developed the Buy Sell Bands technical indicator because I found Bollinger Bands were too vague and they could be used for both trend following and mean reversion, I wanted something specific to use for a mean reversion trading strategy as I didn't like how Bollinger Bands would "squeeze" after periods of contracted volatility, which is a time when you typically you don't want to fade the move and it's often the beginning of a strong directional move. This is something that Buy Sell Bands doesn't do because whilst it uses a moving average for the middle line, the lower and upper bands are based on past and historical volatility of that particular asset and hence I've found through testing this delivers much better results.
What the bollinger bands also lacked was a reference to when the market was in a trending or ranging mode and unable to find anything else freely available that could do so either I also developed the Range Strength Indicator to use in conjunction with the Buy Sell Bands and which tells you with a simple green/red visual indicator if the market is currently trending or ranging, so we can see whether it's a good time to make a mean reversion trade or not, as it's often the trades we avoid that make the difference.
Below is an example of the Buy Sell Bands and Range Strength Indicators shown on the chart.

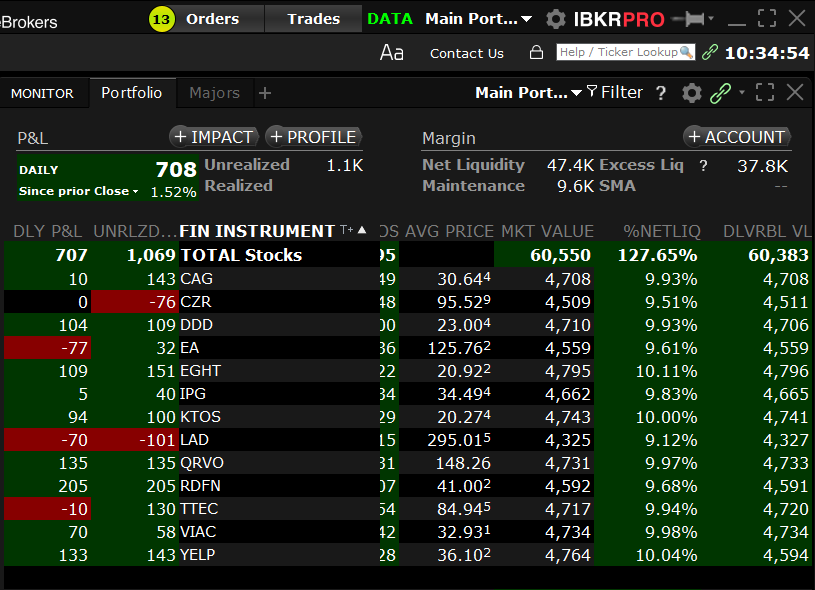
For this journal I'll be swing trading US stocks (long only) in my real money trading account that I just started for this journal (see screenshot in posts below). I'll be using my Buy Sell Bands and Range Strength custom indicators along with several other freely available indicators to find and manage swing trades in liquid US stocks, with the average trade length being approximately 5-20 days. I only enter limit orders outside of market hours, with no day trading, no derivatives, and no shorting.
Each day I spend about 15-30 minutes after market close looking for new trades and entering/updating limit orders in my trading account. I’ll post all new trades I open in this journal with accompanying analysis. The goal is to beat the S&P 500 index return on a yearly basis.
*Disclaimer: All content I post on this site or onto any other website should not be taken as financial advice. I am not a licensed financial advisor. Past performance is not a guarantee of future performance. Trading stocks or any other instrument involves the possibility of loss. Please trade at your own risk with funds you can afford to lose.
I’m not claiming to be a market wizard or selling the holy grail to trading or anything like that, just offering a place where those interested can follow along and possibly find value.
I created the Buy Sell Bands and Range Strength custom indicators as a plugin on the TradingView charting platform that anybody can use and that once installed automatically shows on every chart and timeframe you look at, together with these custom indicators I also offer a private members area on my website with trading strategy videos and other resources that you can use the Buy Sell Bands with, I'm also happy to do my best to provide support and help any traders with any problems they may be having.
I developed the Buy Sell Bands technical indicator because I found Bollinger Bands were too vague and they could be used for both trend following and mean reversion, I wanted something specific to use for a mean reversion trading strategy as I didn't like how Bollinger Bands would "squeeze" after periods of contracted volatility, which is a time when you typically you don't want to fade the move and it's often the beginning of a strong directional move. This is something that Buy Sell Bands doesn't do because whilst it uses a moving average for the middle line, the lower and upper bands are based on past and historical volatility of that particular asset and hence I've found through testing this delivers much better results.
What the bollinger bands also lacked was a reference to when the market was in a trending or ranging mode and unable to find anything else freely available that could do so either I also developed the Range Strength Indicator to use in conjunction with the Buy Sell Bands and which tells you with a simple green/red visual indicator if the market is currently trending or ranging, so we can see whether it's a good time to make a mean reversion trade or not, as it's often the trades we avoid that make the difference.
Below is an example of the Buy Sell Bands and Range Strength Indicators shown on the chart.
For this journal I'll be swing trading US stocks (long only) in my real money trading account that I just started for this journal (see screenshot in posts below). I'll be using my Buy Sell Bands and Range Strength custom indicators along with several other freely available indicators to find and manage swing trades in liquid US stocks, with the average trade length being approximately 5-20 days. I only enter limit orders outside of market hours, with no day trading, no derivatives, and no shorting.
Each day I spend about 15-30 minutes after market close looking for new trades and entering/updating limit orders in my trading account. I’ll post all new trades I open in this journal with accompanying analysis. The goal is to beat the S&P 500 index return on a yearly basis.
*Disclaimer: All content I post on this site or onto any other website should not be taken as financial advice. I am not a licensed financial advisor. Past performance is not a guarantee of future performance. Trading stocks or any other instrument involves the possibility of loss. Please trade at your own risk with funds you can afford to lose.
Last edited: