Although backtest includes an extraordinary black swan, 5 years data just isn't enough imo.
Happy Thanksgiving to all!!
Happy Thanksgiving to all!!
Hey guys, new ET sponsor here, thought I would start a trading journal as a good way to demonstrate my custom indicators and trading strategy in action and create a swing trading community where we can all interact and share. If you like charts and technical analysis then this should be of interest to you.
I’m not claiming to be a market wizard or selling the holy grail to trading or anything like that, just offering a place where those interested can follow along and possibly find value.
I created the Buy Sell Bands and Range Strength custom indicators as a plugin on the TradingView charting platform that anybody can use and that once installed automatically shows on every chart and timeframe you look at, together with these custom indicators I also offer a private members area on my website with trading strategy videos and other resources that you can use the Buy Sell Bands with, I'm also happy to do my best to provide support and help any traders with any problems they may be having.
I developed the Buy Sell Bands technical indicator because I found Bollinger Bands were too vague and they could be used for both trend following and mean reversion, I wanted something specific to use for a mean reversion trading strategy as I didn't like how Bollinger Bands would "squeeze" after periods of contracted volatility, which is a time when you typically you don't want to fade the move and it's often the beginning of a strong directional move. This is something that Buy Sell Bands doesn't do because whilst it uses a moving average for the middle line, the lower and upper bands are based on past and historical volatility of that particular asset and hence I've found through testing this delivers much better results.
What the bollinger bands also lacked was a reference to when the market was in a trending or ranging mode and unable to find anything else freely available that could do so either I also developed the Range Strength Indicator to use in conjunction with the Buy Sell Bands and which tells you with a simple green/red visual indicator if the market is currently trending or ranging, so we can see whether it's a good time to make a mean reversion trade or not, as it's often the trades we avoid that make the difference.
Below is an example of the Buy Sell Bands and Range Strength Indicators shown on the chart.

For this journal I'll be swing trading US stocks (long only) in my real money trading account that I just started for this journal (see screenshot in posts below). I'll be using my Buy Sell Bands and Range Strength custom indicators along with several other freely available indicators to find and manage swing trades in liquid US stocks, with the average trade length being approximately 5-20 days. I only enter limit orders outside of market hours, with no day trading, no derivatives, and no shorting.
Each day I spend about 15-30 minutes after market close looking for new trades and entering/updating limit orders in my trading account. I’ll post all new trades I open in this journal with accompanying analysis. The goal is to beat the S&P 500 index return on a yearly basis.
I’ll keep the Google sheet below updated with all trades I make and performance stats just so it’s all in one place for easy reference. I’ve also listed my trading rules I’ll be following in there too.
*Disclaimer: All content I post on this site or onto any other website should not be taken as financial advice. I am not a licensed financial advisor. Past performance is not a guarantee of future performance. Trading stocks or any other instrument involves the possibility of loss. Please trade at your own risk with funds you can afford to lose.
I didn't cherry pick, I've ran backtests for the same stocks on the first page from 2008 until now and they all recovered fine after 2008 and covid with most ending the 2008 year with a profit, $FB wasn't around then so I tested $AAPL instead and $BAC didn't show results for some reason so I used similar stock $JPM and that showed a profit in 2008 too. The indicators only trigger several entry signals per year per stock with an average trade length around 20 days and yes during bear markets there will be more losses as there are with all long-only strategies, and I'm fine with that.
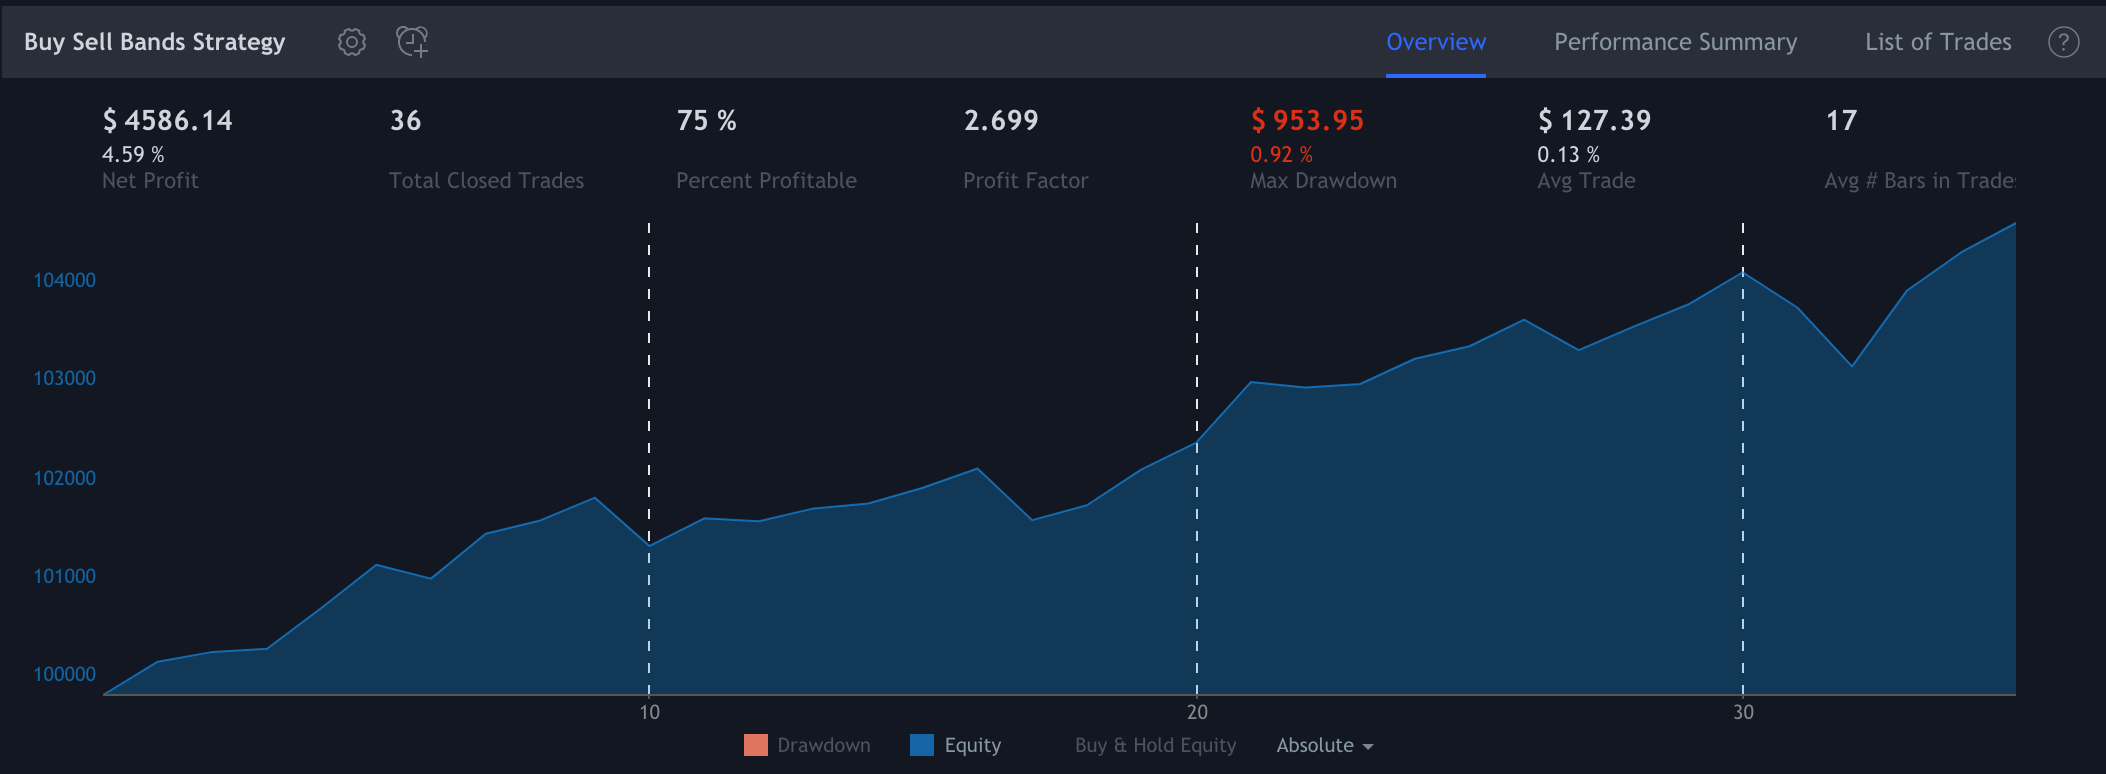
$MCD 2008-2021 Back test Results
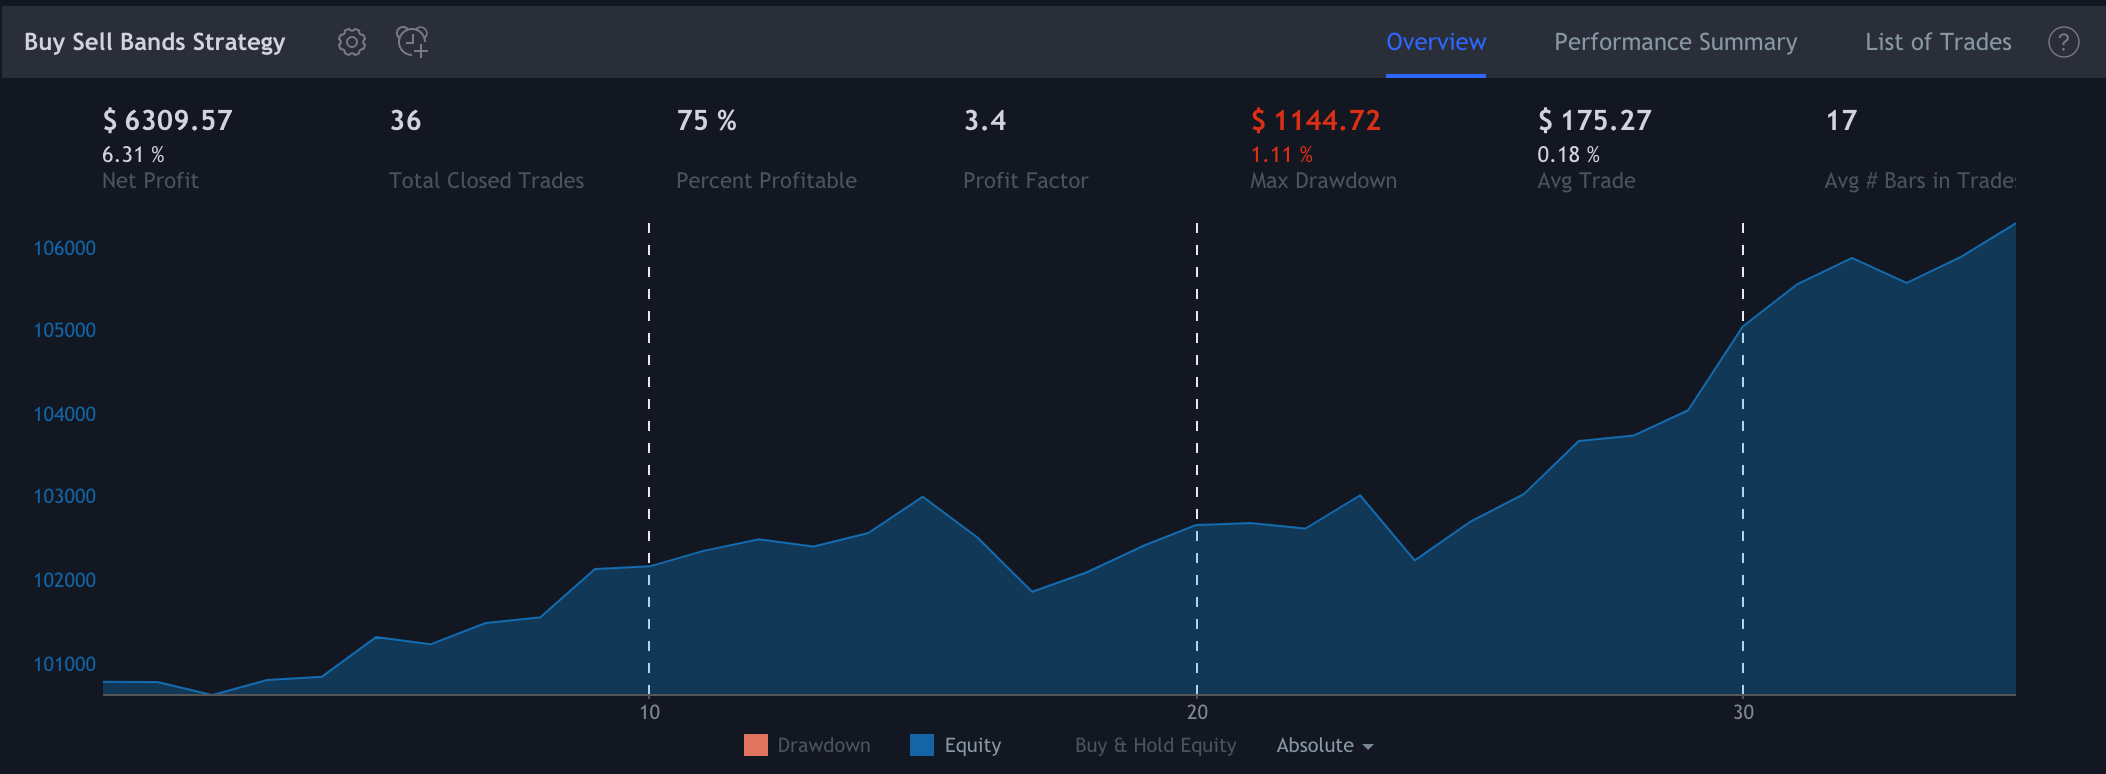
$WMT 2008-2021 Back test Results
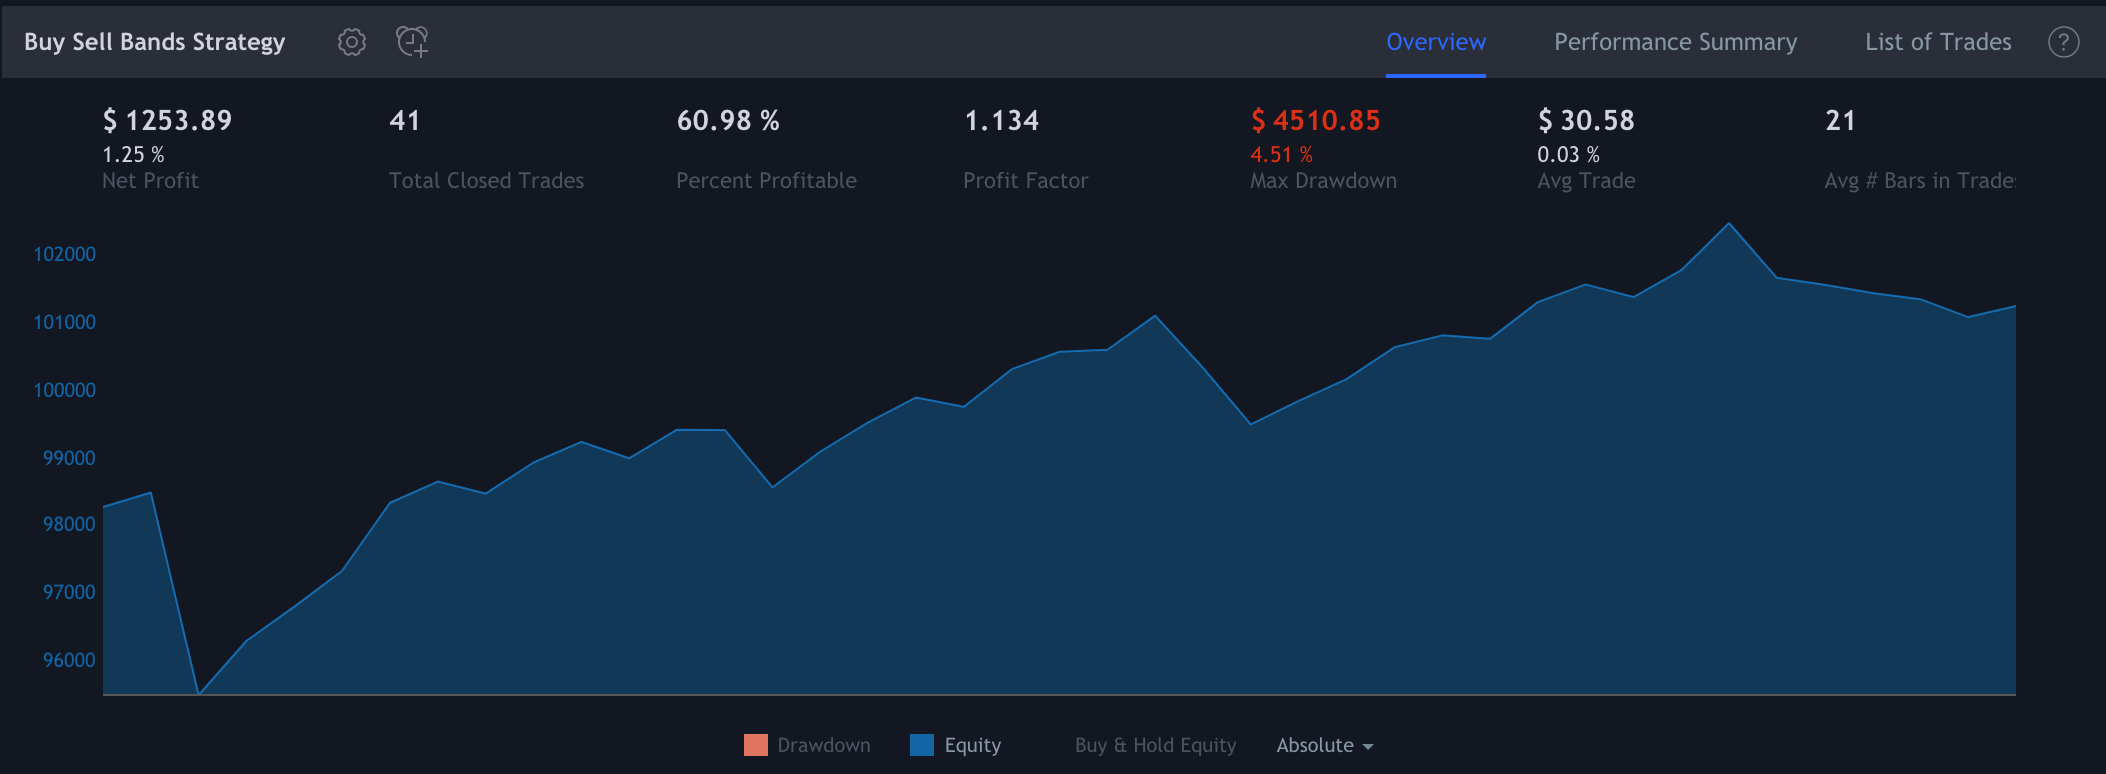
$JPM 2008-2021 Back test Results

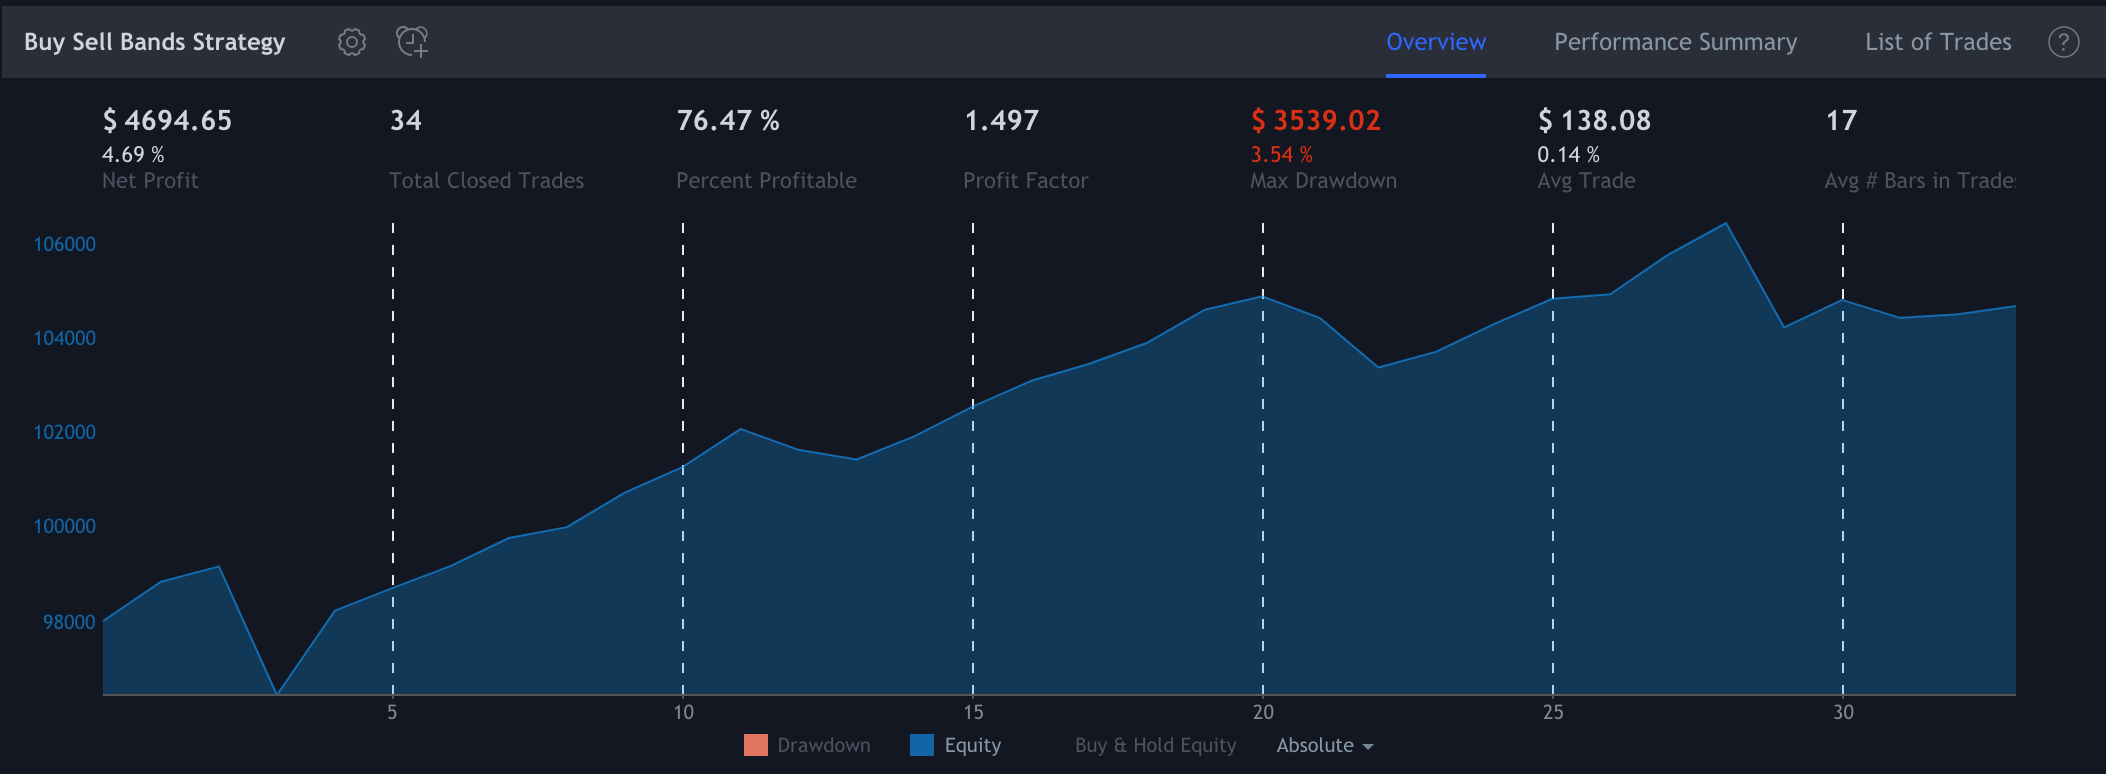
$INTC 2008-2021 Back test Results
$AAPL 2008-2021 Back test Results
Appreciate the straightforward report format. Break A Leg!
Thanks for the results but it doesn't look like they beat buy and hold with the exception of JPM, WMT. Hard to tell without sharpe ratio. It will be hard to forecast which stocks will continue to do well.
Hey tiddlywinks check the last post I made, it shows backtests from 2008 until now.
Looking at drawdown, seems the system is best suited for low beta symbols.
That's exactly how the system is meant to function. I don't want to be investing in a down trending market.Nice one, the only thing with this if the market goes into a prolonged bear market you could be in cash for several years or longer most of the time with plenty of false starts, for example the Nikkei for most of the early 90s spent most of the time under the 200ma.
That's exactly how the system is meant to function. I don't want to be investing in a down trending market.
I'm considering inverse ETFs but haven't found anything I'm comfortable with at this time.