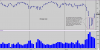
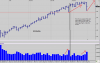
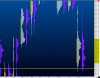
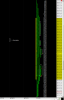
8/26/15 Recap and prep (for 8/27) It appears to me that most of the morning the mkt was adjusting the long overnight inventory. Buyers were waiting in force near yesterday's settle. 41 contracts on the low which was 7 ticks above the settle.
When traders do not wait until a mechanical reference (mechanical references are levels such as O/N high and low, pit session high and low, 1/2 back, etc.) to step in, it is a sign of strength. Between these innovators, early adopters and the rest of the herd, they steamrolled the bears - and any other trapped shorts expecting more range extension to the downside.
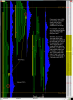
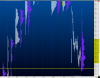
Tomorrow may reveal whether the rally was purely short covering and/or new money buying. Short covering alone weakens a mkt as it removes buying power, and once complete, the mkt usually resumes the direction it was moving. If there was enough longer term new money entering the fray, then continuation is very likely.
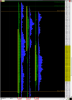
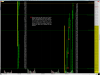
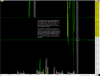
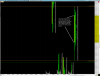
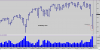
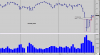
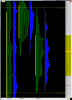
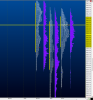
Nonetheless, today was a balancing day as it was an inside day. On a daily chart the 3 day balance can be clearly seen.
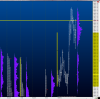
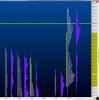
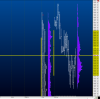
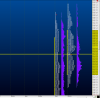
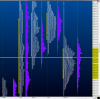
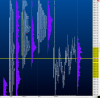
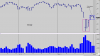
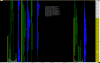
The profile graphic today is very reduced, I had to do this in order to fit the last 3 days. I want to show how value has been developing over the same. Viewing this confirms a mkt that it is in short term balance. Value areas are the gold bars to the left of the profiles
When traders do not wait until a mechanical reference (mechanical references are levels such as O/N high and low, pit session high and low, 1/2 back, etc.) to step in, it is a sign of strength. Between these innovators, early adopters and the rest of the herd, they steamrolled the bears - and any other trapped shorts expecting more range extension to the downside.
Tomorrow may reveal whether the rally was purely short covering and/or new money buying. Short covering alone weakens a mkt as it removes buying power, and once complete, the mkt usually resumes the direction it was moving. If there was enough longer term new money entering the fray, then continuation is very likely.
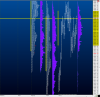
Nonetheless, today was a balancing day as it was an inside day. On a daily chart the 3 day balance can be clearly seen.
The profile graphic today is very reduced, I had to do this in order to fit the last 3 days. I want to show how value has been developing over the same. Viewing this confirms a mkt that it is in short term balance. Value areas are the gold bars to the left of the profiles