Thank you neke. Exactly my point. The declines are much easier to trade. It's a shame that the average investors have never done any shorting. I mean literally in my circle of friends and such I don't have a single person who has ever done any shorts. And god help you when you try to explain to them how a short works.When you realise that 2010 to 2016 has been a tremendous bull-run, to see the number of big decliners outpacing big runners makes my point.
Now based on hard-data based on my premise (avoid big moves that are just dead-cat bounces from prior sell-offs, or sell-offs following prior run - no new 3-month price level record being set), I went back ten years ago (June 2007 till date on the SPY), and here are moves meeting my definition. Only two run-ups, and 22 declines
Run-ups
Date Fractional rally
04/05/09 0.03402
27/10/11 0.034835
Decliners
Date Fractional decline
15/09/08 -0.04759
17/09/08 -0.04496
29/09/08 -0.07836
06/10/08 -0.05093
07/10/08 -0.04479
09/10/08 -0.06984
24/10/08 -0.05071
27/10/08 -0.0355
19/11/08 -0.06408
20/11/08 -0.07423
23/02/09 -0.03578
02/03/09 -0.04504
05/03/09 -0.04085
04/02/10 -0.03087
20/05/10 -0.03776
04/06/10 -0.03514
29/06/10 -0.03088
04/08/11 -0.04684
08/08/11 -0.06512
21/08/15 -0.03108
24/08/15 -0.04114
24/06/16 -0.03643

You are using an out of date browser. It may not display this or other websites correctly.
You should upgrade or use an alternative browser.
You should upgrade or use an alternative browser.
Market loss is 3x faster than market gain
- Thread starter Jdesey
- Start date
When you realise that 2010 to 2016 has been a tremendous bull-run, to see the number of big decliners outpacing big runners makes my point.
Now based on hard-data based on my premise (avoid big moves that are just dead-cat bounces from prior sell-offs, or sell-offs following prior run - no new 3-month price level record being set), I went back ten years ago (June 2007 till date on the SPY), and here are moves meeting my definition. Only two run-ups, and 22 declines
Not sure if I completely agree with your logic, but allright.
As traders, I think the most recent past and current market conditions should be our major concern and focus of attention.
One could also argue that your sample now includes the financial crisis which in my opinion is not part of normal market conditions.

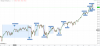
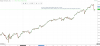
The down side speed is significantly greater, not in distance but in speed - this is not even debatable since its such an obvious fact when you look back on the charts a few years using candles. Traders can make large profits far faster from shorting than from the long side. The most common trading mantra spoken is ' the market takes stairs going up and the elevator going down'. Up legs are shorter and have much slower congestion zones - looking like stairs.
Last edited:

The down side speed is significantly greater, not in distance but in speed - this is not even debatable since its such an obvious fact when you look back on the charts a few years using candles. Traders can make large profits far faster from shorting than from the long side. The most common trading mantra spoken is ' the market takes stairs going up and the elevator going down'. Up legs are shorter and have much slower congestion zones - looking like stairs.
View attachment 174528
View attachment 174529
So, are we agree on the 'Bull - Contracting', but 'Bear - Expanding', terms?

Shorts deliver faster but smaller total profits, while longs deliver slower but bigger total profits.
If you would only go short you would have made the last decades less money then when you would have gone long. The net accumulation of profits is the difference between the starting point and the end point. And as we are already decades in a bull market the totality of the longs deliver more profit.
The S&P500 went from below 500 to over 2400. So the net move was +1900 points long.
If you would only go short you would have made the last decades less money then when you would have gone long. The net accumulation of profits is the difference between the starting point and the end point. And as we are already decades in a bull market the totality of the longs deliver more profit.
The S&P500 went from below 500 to over 2400. So the net move was +1900 points long.
It's gotten way off topic of where I started. I never said I only go short. My only point is that for scalping on a daily basis shortd give faster more predictable results. Obviously I go to whatever The opportunities areShorts deliver faster but smaller total profits, while longs deliver slower but bigger total profits.
If you would only go short you would have made the last decades less money then when you would have gone long. The net accumulation of profits is the difference between the starting point and the end point. And as we are already decades in a bull market the totality of the longs deliver more profit.
The S&P500 went from below 500 to over 2400. So the net move was +1900 points long.
It's gotten way off topic of where I started. I never said I only go short. My only point is that for scalping on a daily basis shortd give faster more predictable results. Obviously I go to whatever The opportunities are
I was not pointing at you. Just wrote down my reflections.
I confirmed that shorts go faster like you posted.
%%Once you get caught in a rush to cover shorts, you'll learn the hard way that there is indeed such a thing as panic buying.
Good points on panic buys, Lindq; i was thinking of trend days[panic buys] but your points still stand LOL