
You are using an out of date browser. It may not display this or other websites correctly.
You should upgrade or use an alternative browser.
You should upgrade or use an alternative browser.
Market disconnect: ES & SPY
- Thread starter FireWalker
- Start date
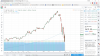
Firewalker, are you saying there is a disconnect because the futures did not break through their 200 day MA like the SPY did? Question - I would guess that such a thing was relatively common as the futures are often off of the spot price, no? Not sure though. By the way, isn't it maybe a moot point at least temporarily, as the spot price bounced off the 200 day MA and shot way up (maybe consistent with the futures not falling as much)? Thanks!

No need to get overly technical. or anal. 
but the SPY/SPX/DOW/ES are all essentially the same thing,
They all move in sync, and represent 'The Market.'
but the SPY/SPX/DOW/ES are all essentially the same thing,
They all move in sync, and represent 'The Market.'

SPY/SPX's much lower low:
SPY and ES are calculated and managed very differently. SPY is a closer approximation of the 500 stocks in S&P's list (or at least it's supposed to be).
Me thinks you might be the one with the disconnect? Where do you see a disconnect between ES and SPX?
As of close Friday they differ by 2 ES points? 8 ticks? That is not a disconnect. That is flowing mojo.
Last edited:

Indeed. The horizontal axis (time axis) on both charts is very different.I think you are comparing two different time frames. ES is daily and SPY is 240 min (I think). That is why 200 ma looks so different
