Time to log
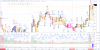
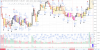
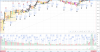
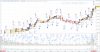
24th Session of MADA on 09/24/19 - 44EE's IDd
PART 1
PART 2
PARTS 3&4
PART 5
Lunch time

Time to log
24th Session of MADA on 09/24/19 - 44EE's IDd
will only do another log.

Thank you for the sharing.
Then, let's play the 7 differences game.
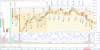
View attachment 210229
- here on the INT, there is a consideration of a BO,T1. It is IDd on a non measurabe bar. This is then taking into a count statistically non significant value. If this is dissonant with my current level of understanding, differenciation, it means there can be a higher/deeper level one which can lead to consider a BO,T1 on a UL wait. Maybe this echoes to "anticipation" ? Don't know yet.
Review the definition of a failsafe.
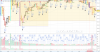
View attachment 210230
- next difference I notice is that there is no color blobs refering to MR table, but 2 colors for blob as black for longwards turns, and red for downwards turns.
The scaffold is like training wheels. Once one has balance then the training wheels are no longer necessary. The scaffold of the color associations were to logically flow through the associations between the MT and the MR tables.
- c-turns are in bold, so that it's more distinguishable from a and b ones.
- when a FS occurs both with a PP!, they are both annotated although FS takes precedence.
On OB's having a FS also has the bar have two turns.
- on bar 75, BMrev seems to take precedence on Ah. Due to prior PP1a, P1 was to be ass'd next. If not BMrev I'd have IDd Ah but BM is there, it seems to take precedence and absorb Ah.
Bar78 gets a Ja treatment. Ah can only come on the bars after (depending on whether there are waits or not determine how many bars after.) Ja is an EE that does not have a BM associated with it.
- the way PP1's are ID indicates clearly that price pane is NOT taken into a count as for IDing this particular PP!. Recently, while rereading litterature, I read about Ac HVBO : You have 3 P1's BUT they do not accelerate. This would confirm @tiddlywinks assertion on PP1 as for "PP1 does not involve price pane" AND this would invalidate my way of seeing it up to now. Although I don't see very logic the fact that the AddReq would not be bringing some ADDITIONAL requirement to the description, the way PP1's are here IDd leads me to say : I don't understand the way it has been described in the PP!s sheet, but ok PP1 does not involve price pane.
Price pane is first checked for a measurable bar as well as establishing the geometry of trend segments. The tools of FS's and rtl's establish whether price within a boundary or not.
- some EE's receive an assigned P1 on them, so we must have one and unique BM, while others assign P1 on next bar. Up to now, it has been said to me to both put a BM on each EE AND on each P1 ass. This must lead for any EE being neither an A-band nor a FS one, to have two BM's. I can only see one BM each time there's an EE and when P1 is ass on next bar, it does not receive the second BM in question.
There were suggestions made in the past that were applicable to your level of discernment. Think of them as scaffolding in order to build the structure underneath. Scaffolding doesn't invalidate the structure but at some point in the development of the building it is no longer necessary.
- I also notice as for BO,T1 : some weeks maybe months ago, I switched from a "non complete understanding of true BO,T1" to "true BO,T1 complete comprehension" AND from "true rtl" to "non true rtl" concepts. I can see now, on this chart that :
-> there are BO,T1's IDd after a P2 is IDd in the trend, which dissonates with my current understanding of all needed requirements for BO,T1
-> there are BO,T1's that break non-true rtl, like on bar 9:45am of this chart. I can understand here it may deal with anticipation AND being as that's what I had been doing for a huge while during the past.
The use of true/not true in how you are using them will be problematic. A BM and a rtl - establish 'lines in the sand' and if crossed trigger an event. If you think back to the exercise of the ten price cases, each two bar case have 4 points. Points 1,3 define a rtl. In the case of a Hitch there are still a rtl and a ltl.
Again review the definition of a Failsafe.
- some EE's do not receive any color blob. Not even black nor red. At first, I assumed the whithout any-blob turns were the non-move reversals turns. ut when came OB 10:30 and b-turn surged due to prior a-turn into C-set trend on a BMrev, which is a move rev, I knew it was not the reason. I don't know yet.
Sometimes there are mistakes in my charts that debriefs do not catch. Hence my goal of building a circle of peers.
- concerning OB's, I can see many of them crossed by prior rtl and not used to fan. The fanning on OB's was something I had seen in some of your charts in the past and I thought it was the correct way to do it, thus I have been doing it this way up to now.
Iterative refinement. When I'm working through different operating points you'll see the artifacts in my posted material. Sometimes an operating point provides greater clarity, other times it does not. Different operating points are supportive at different times in the learning process. Sometimes, introducing a more complex idea has the effect of causing a 'two steps back' effect.
- I notice, like on bar 8:30am that :
-> the BM rep is not placed
-> when it becomes possible to draw a short rtl (08:35am), it is not IDd although on next bar a BO,T1 is IDd.
Not sure which chart/bar you are referring to.
- on some bars, BMrev is IDd when close is excedding it, sometimes just penetration by any leg of the bar seems to be a valid happening for BMrev. This is what I see on last bar where, even after degap I think the close of last bar would be on prior short BM.
I do closes. As for closes, lots of times the close is right on a boundary established by BM or rtl's. Whenever I get a chance to advance a trend, I do.
There must be more, but at first sight that's what jumped to my eyes when seeing this chart.
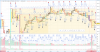
View attachment 210232
This snippet shows something great that deals with one of, maybe the, last things I had noticed during I believe, my 20th Session on 09/19/19.
Deals with Lats. Beyond the geometry rule as for the shadow of Lat1 that must include we know what, the Lat definition states when first (so before any possible retro triggered) IDd, the second and third bar of a Lat must not be measured. So, can't be measured.
On my last session, I talked about the fact that I had noticed during prior sessions I had IDd consecutive Lats in the same maneer as you did here AND about that in this case, I would see a Lat too.
But not in the following :
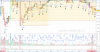
View attachment 210234
At my level of differenciation (LOD) : Leftmost bar is Lat4/1. Until Lat11, no close is outside of the Lat. Then Lat11 does have its close outside. Then next bar has its close inside so it is measured still as Lat has only been functionally BO's, not technically. So lat is not ended. Next bar continues to be in prior Lat. It is measured.
You are correct, my error. Lat11 is actually a Lat14.
So I'm here in front of a case where, contrarily to what appears on this chart which has been made at a higher LOD than mine, I would have IDd the second Lat2 and Lat3 as Lat12 and Lat13.
In addition to that, when thinking about degap : at second Lat2 (what I'd have IDd as Lat12), the degap currently required is at -1 compared to the position of Lat1. So either in deep or in appearance, second Lat2 (my Lat12) has its close insode of the Lat.
- another remark on Lats : although JH clearly says (but maybe he does not only say this on this thema) no rtl should be drawn inside a Lat, I see on this chart every Lat receiving rtl inside of it, I mean, begun inside of it. I DD :
-> either JH added more differenciation which can lead one to draw rtl's inside a Lat
-> or I've misunderstood the real and whole meaning of what he said
-> or this chart is done at a higher LOD than JH's
-> or something else I can't imagine for now
At the moment, I'd opt for the first.
This statement should be interpreted in context. He does state that and he also states that as one's differentiation increases, one naturally trades faster and faster timeframes.
What was once impossible to trade becomes possible.
This is why one can only grasp the Hershey material through deduction and not induction.
View attachment 210235
- I see the treatment of Bar 78 (just after the b-turn bar) different than the one I'd have had. Prior bar says BO,T1, then volume is INC. So P1 repeat, but we're on bar78 so special treatment : advance one peak, so P2 already. I thought this would suit to the Ah : P1 replaced T1 and P2 appeared before T1.
It looks like no.
Ah is an EE that comes after bar78. Ja is the EE that occurs on bar78.
- I see a rtl drawn between bar77 (b-turn bar) and next one, which can't be if on sticks to geometry but only if one uses the mentally seen position of the bar after degap. That's something I've never seen before.
Degapping is degapping. If Bar77.L < Bar78.L is true then a rtl is drawn.
- price bar 78 has its close below its open and it's black. Meanwhile, its corresponding volume bar red. Looks like volume color, here, follows relative position of close/open of price bar, while price bar color follows....prior price bar's close ?
IBGS
Maybe it deals with this :
View attachment 210237
and this
View attachment 210238
Those are scripts that colors the bars. The first is an older version of the second.
- finally, I see somehting that I was waiting for, since it has been mentionned to me that it will be one of the next/remaining/final step to incoporate :
View attachment 210239
Again is a script that is used during RTH. To have it on the chart would make the chart super cluttered. The code is in the literature.
- I don't know what the first line of the infos in the upper left corner mean (text4 and arrows).
Attempts to have Tradingview automate labeling. It might be capable at some point but back when I attempted it the scripting language was not developed enough.
I will let this rest a bit, and continue EE's Matrix meanwhile.