...cont'd
The following will be like retro but on a larger scale.
To start with turns and trends, what you are looking for are a change in the dominance of a trend. As you have been overlaying the SCT trendlines, one can see the pt2 of the opposing trend correspond to increasing relational volume bars in the volume pane.
Depending on what Set type of trend/trend segment it is (A,B,C,D) will give an accurate starting ID of a turn and associated trend OR it will spawn a retro (on a trend/trend segment level) to ID the turn. What this means is that one would go back in time on the annotated chart to re-ID a turn.
An alternative is that one can also just go forward from this starting point. The process is self-correcting as one progresses forward.
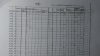
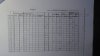
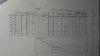
Using the 30m, one can see the larger trends shift in Dominance. From here zoom into the 5m and using the Modrian table look at the 4 vertical grouping of the 8 cells. Each cell is composed of 2 columns, a 'n-1' and a 'n' column. Since you are in the 'now' you are looking at the 'n' columns within the cells.
You'll find a listing of EE's. Find the 'now' EE that you've identified.
As you know; EE's are the ends of trends/trend segments. We know that the archetypal pattern is composed of three moves;
M1 is Dom to Dom,
M2 is Dom to non-Dom,
M3 is non-Dom to Dom.
This archetypal pattern completes, extends itself or is incomplete by being interrupted. To express this in SCT terms: On one level of awareness this is true on any particular fractal. On another level of awareness, all trends complete. At this level of awareness, the completion of a trend on one fractal level occurs within the nested faster fractal.
Using the archetypal pattern, we take the case that it completes and yields to another archetypal pattern in the opposite direction. b2b2r2b -> r2r2b2r -> b2b2r2b -> r2r2b2r etc...
From here we know that the pt2 of one pattern connects to the pt2 of the next pattern through a move from non-Dom to Dom.
As Jack has stated, "we can know a know a thing by knowing what it is not."
In the case that a pattern is incomplete this pattern gets interrupted from M2 -> M3 and the return to Dominance of the current trend and becomes the M1 of the new interrupting trend as b2b2r2r/r2r2b2b.
In the case that a pattern is complete this pattern is not interrupted and completes as an archetypal pattern M1 -> M2 -> M3.
In the case that the pattern extends itself, then M1 -> M2 -> M3 -> M2 -> M3 or b2b2r2b2r2b/r2r2b2r2b2r.
Back to the Modrian Table. It's basic structure can have additional groupings. The eight cells can also be grouped into 2 groups of 4 cells. When grouped as Trends Sets A,B and Sets C,D then we have incomplete vs complete. When grouped as 4 cells per horizontal group, then it's FS's and Routine.
Here's where the retro process comes in. Let's say you have on the current bar a BO,T1. There are multiple places on the Modrian table where this exists. So then one looks at the previous EE ID on one's chart/log and finds the pairing. Let's say it's another BO,T1. Since they are two FS's, then one confines their search to the upper row of cells. Still multiple choices from this level of awareness, and that's OK. As one trusts in the process, it will be auto-correcting.
Let's say we go with BO,T1 as 'n' and BO,T1 as 'n-1'. We have now located a C-C turn.
Now the next EE presents itself in another 'n' context. Our previous EE is now an 'n-1'.
Now our 'n' EE becomes an 'n-1' and we ID'd it as a BO,T1 C-C turn, we look on the list of 'n' and we either find our new current EE or we do not.
If we do not, then we have collected a 'Fail' or 'False' as another C-C turn. If it is not this, then it has to be an 'A' Turn and label this new current 'n' EE as that.
Now the next EE presents itself, the trend is moving forward or it is not. The market system of operation presents itself as trends that develop in an irreversible manner unless they are interrupted by a new trend. When new, then start again at the beginning.
If it is moving forward then we look in the Trend Set B: C-A-C column of the Modrian table and our previous EE is an 'A' Turn thus being located in the 'n-1' column and we are looking in the 'n' list of the C-A-C column of 2 cells (FS and Routine) for a match. If we find a match, then we have located another 'C' Turn as the C-'A-C' pairing of B trend that it implies. If we do not find a match, then we have collected another 'False' and the trend has progressed to present a 'B' Turn. We label this EE as a 'B' Turn and the trend progresses irreversibly.
At any point if we do find an EE on the 'n' list of Trend column cells then we have located a shift in Dominance as a 'C' Turn implies. When locating a 'C' Turn we return to the 1st cell of the Set 'A' trend column and begin again just like the VTP always returns to a P1 when a trend/trend segment fails to continue.
This is where your prior work of ID'ing turns at a beginner level will begin to make sense. The practice built a frame of reference by which all of the above will fall into place relatively quickly.
When something fails to continue, then we have change. This is the binary result of a boolean operation. This is distinct from constructing a dataset using boolean operations to log a result in binary notation which can translate to decimal numbers greater than 0 and 1.
In PVT, this scoring goes from 0 to 7. Each score defines a position that a particular equity is in with regards to it's expressed Price Volume Relationship. This score is the binary result of a dataset that has multiple elements. Each element goes through a boolean operation. When Jack introduced PVT, it was meant as a foundation, a place to build from. There are concepts in it that are not mentioned elsewhere.
Thus from this introductory system and through successive cycles of iterative refinement, the Modrian Table is constructed on negative logic and it is the collection of 'falses' that move a trend irreversibly forward. On a fractal level, Jack's entire work went through iterative refinement to become more and more precise.
It's beautiful in its simplicity when viewed from within yet ironically from the outside looks hopelessly complex.
Currently studying this post, pairing it up with this one :
Comments with quoted text.
In addition to that :
"To clarify, one can save templates but when one makes a new drawing element and when choosing from this list of user-defined templates, the drawing element when pasted does not show the change. One has to select the drawing element pasted and repeat the process before the pasted element changes.
The above is a bug with Tradingview that comes and goes as they make amendments and changes to their software. I've been back and forth with them several times about it. It gets corrected and then the bug reappears.
After you paste a text label, right click to show the context sensitive menu and choose templates from here. Then use copy/clone and paste off this menu for repeating elements.
Tradingview's drawing capacity fills pretty quickly, so it's good to have each day as a separate labeled chart and to screen capture that chart after the day."
Either don't I do correctly what you stated here or the bug is persistent. TV doesn't let me use the templates. Nevermind I'll sove this and while this is not done, I'll do it by hand.
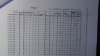
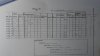
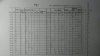
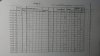
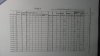
While I'm studying the use of Modrian Table and the labeling of trend types/turns , I'll now do another log and try to incorporate to it what I understand from the two nice explanations I have about Modrian Table.
NB : previously I had planned to follow an order of logs starting from a date until I would arrive to another one. By having some days of interruption, I overcame the date whene TV conserves the datas and I cant now follow the order planned. So I'll jump some days on the past and will be logging now from a date I'm sure that will let me have all the datas : from 05/01/19.
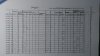
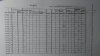
NB : as for logs, I now find clearer to only annotate BMrev or BO,T1 when there is one and not the P1 assigned too. Just the FS. Is that acceptable ? as P1 is implicit when BO,T1 or BMrev are there.
Last edited: