A considerable amount of work and things to study on has been asked to me. I am happy to have so many things to do cause it means my effort is fertile.
Nonetheless, I am completely overwhelmed now. This is simply too much. WAY too much. There are too many things to work on at the same time, I cannot anymore.
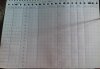
I've done my best in what I post to integrate absolutely everything that is to appear on the chart since my level on the SCT.
@Sprout, I have also drilled on the 3 rows of Volume arrows. It is quite the same feeling as doing the VTP. I used the example you provided me, tried to see the end of the arrows after B2B or R2R on pts 2, but I do not even see that at each time on your own chart.
You'll have to post bar numbers.
A question about this : is each row of volume arrows related to each of the three nested fractals ?
Yes AND,... the AND is where you need more discernment. It's not as rigid as you think. It's more like sailing than it is going around a racetrack with a curb at the edges. One can apply racetrack thinking to sailing and it's symmetry.
I maybe need a day off. The VTP is really something that drives me mad, in a serious sense. In all the explanations I have read about it, there may be some things forgotten, implicit, badly said or volunteerly hidden by those providing the explanations. It is not normal I can't do this test yet.
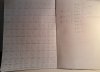
I join the matrix I think you want me to draw. Is it what you expected ?
Yes, AND,...
1) draw tapes on the these bars. Notice when the third bar gets included in the on a fan and when it is not. What is volume doing? What is the form? What is the sentiment of the bar? There are repeats that can be distilled and reduced to a finite set of unique bar combinations.
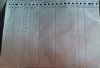
What happens when volume is now added?
And do you want me to combine the volume cases to each of the 100 cases ?
That's how one gets fully differentiated. To define more clearly that which has not been defined.
This seems enormous to me as for combinations, that's why i'm asking as it looks weird.
It is work. Only a few will attempt it, most will think that reading will accomplish the same thing or that it's too complex and that there is a simpler way.
And I do not know what are PP!'s.
It's a the broad classification for all the PPx's.
I don't know how the bands work, neither what they refer to. I don't undrstand what is meant to do.
That's because you have not discerned the 3bar PP!'s. Just like in the geometric organization of the price cases, the internal bars are a wait and not measurable, the majority of the 3bar combo's are not EE's. They are in the thread you mentioned in your first post. If you do not know where to find the answer, then you are not reading for comprehension nor making notes for reference.
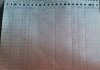
I've given my best to do everything that is posted, especially the VTP but the only feeling I have is that I filled the cells whithout any comprehension nor any idea of what I'm doing. Almost everything must be false. It makes no sense to me.
It's looking good. There are mistakes, it's not a big deal, iterative refinement combs over it until the sticking points get cleared away from your own logical deductions.
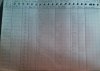
A couple of things.
1)The "X" in the P1 cell gets marked only when T1 is False.
2)To get to T2P one needs to do reverse chron on each prior event of the OOE to collect Falses. It's only then does one circle around the False in the P1 cell to return to T2P. Sometimes this reverse chron process stops at a True for P1.
Can anyone please take the sequence I post here, and join the VTP applied ? So I could compare and maybe understand something...