Ive always had this filter, but seems IB TWS doesnt. Y/N?
Is there another 3rd party platform that has this you know of an/or can something be created and used in conjunction w IB TWS
Tks
https://help.streetsmart.schwab.com/pro/4.36/content/Highs_&_Lows.htm
Highs and Lows
Stocks breaking new highs or lows may be breaking through resistance or support levels, possibly indicating a changing trend.
Find stocks and indices trading at new highs and lows on an intraday and/or 52-week basis. Take advantage of the proximity alerts to recognize when stocks are trading near their intraday and 52-week highs and lows.
The Highs and Lows window displays the stocks on either the NYSE or NASDAQ exchanges that are breaking daily highs and lows, plus 52-week breaks and proximity alerts. The NYSE window will display all listed equities, not only those traded on the NYSE. You may open up to four High/Low windows at a time.
Stock symbols and price and volume data shown here and in the software are for illustrative purposes only. Charles Schwab & Co., Inc., its parent or affiliates, and/or its employees and/or directors may have positions in securities referenced herein, and may, as principal or agent, buy from or sell to clients.
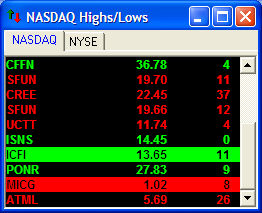
This figure shows a typical NASDAQ/NYSE High-Low window, with a brief description of the colors and highlights. Colors used are the default colors.
Is there another 3rd party platform that has this you know of an/or can something be created and used in conjunction w IB TWS
Tks
https://help.streetsmart.schwab.com/pro/4.36/content/Highs_&_Lows.htm
Highs and Lows
Stocks breaking new highs or lows may be breaking through resistance or support levels, possibly indicating a changing trend.
Find stocks and indices trading at new highs and lows on an intraday and/or 52-week basis. Take advantage of the proximity alerts to recognize when stocks are trading near their intraday and 52-week highs and lows.
The Highs and Lows window displays the stocks on either the NYSE or NASDAQ exchanges that are breaking daily highs and lows, plus 52-week breaks and proximity alerts. The NYSE window will display all listed equities, not only those traded on the NYSE. You may open up to four High/Low windows at a time.
Stock symbols and price and volume data shown here and in the software are for illustrative purposes only. Charles Schwab & Co., Inc., its parent or affiliates, and/or its employees and/or directors may have positions in securities referenced herein, and may, as principal or agent, buy from or sell to clients.
This figure shows a typical NASDAQ/NYSE High-Low window, with a brief description of the colors and highlights. Colors used are the default colors.
- CFFN has hit a daily high for the fourth time today.
- SFUN and CREE have hit a Daily Low 11 and 37 times, respectively.
- ICFI is hitting a 52 week high for the 11th time today and MICG is hitting a 52 week low for the 8th time today.
