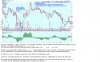
In the following chart , I change the indicator from the standard 12,26,9 to a much faster- 3,16,9 You can input any numbers you want-to test.iN MY 401K i AM RESTRICTED- I have a selection of mutual funds I can "invest in" -
The company that brings these funds to market actively manages the different funds, charges an expense ratio, 12-b-1 fees, and there are undocumented turn-over-transaction costs- All come out of my account as a combination of fees called the Expense ratio, 12.b.1; and transaction costs- since I am in an IRA, I am not charged the capitol gains due to the turnover- but the holder of the fund is charged the transaction costs and may have to pay capitol gains whether they sold any shares or not- because the management did.
All the more reason to learn about passive- low cost investing with Vanguard.
Because the overall company account is large enough due to the pool of monies contributed by other employees, I am not charged with a load fee or transaction costs, but i cannot put in a stop-loss under a position, and i cannot move more than $4,999.00 in any day out of a single position without being "locked out" of being able to make transactions in that fund for a 30 day period- Vanguard has a similar lock-out- but after 12 such transactions .
The reason the underlying company does this is to discourage trading of the funds and market timing. Mutual funds are generally actively managed, and hope to exceed the performance of the benchmark index- Most fail to deliver additional gains after costs that beat the index. - This is an important point to comprehend- and I would encourage any reader in a similar position to look at Vanguard for the retirement IRA or 401.
The specific trade i am illustrating here, is that the one Fund- AGTHX- US growth fund- has hit a recent market high after months of sideways and choppy price action.
Going back to the concept of keeping it as simple as possible, I am posting a chart that simply has a moving average (7 ema) displayed- You can determine - without seeing the price - when the trend is increasing- the ema is rising- and when the trend is declining- because the ema is turned downwards.
The ema line is a lagging indicator- It is an average of the prior 7 periods - and because it is exponential, it gives more importance to the more recent periods than the earlier periods in the 7 periods- Price will have to go below the indicator line before it ever shows a downward slope- Conversely, price will close above the declining ema line in order to reverse the line direction- Understand then- that Indicators follow price- or Lag behind.
In this chart - i am posting the 7 ema line and the 12,26,9 period MACD indicator.
The MACD is (moving average convergence/divergence) simply takes 2 moving averages of price and determines whether the momentum is increasing or decreasing or is flat.
This is usually averaged from a 0 base line .
The actual indicator with lines is useless and delayed- My opinion- Forget the lines- learn the histogram.
The "Histogram" a series of vertical bars above or below the 0 line is of far greater relevance. If someone wanted to choose a single indicator for collaborating a trade decision- this is a good place to start- IMO- One needs to verify this on what they trade to see if it is of any benefit.
As the bars increase above the 0 line- price is appreciating, momentum is favorable-
As those bars start to decline in height relative to the 0 line, the momentum is slowing-
There are 'Divergences'- a slowing macd histogram does not mean that price is about to drop today or tomorrow- But one should be aware that buying strength is not as enthusiastic as it initially once was.
This chart uses a 12.26.9 'standard setting' which is slower- more cautious- to respond to price movements- AGAIN- Indicators LAG and indicators are built on smoothing out price volatilities. Using an indicator, you will not leave a trade at the top nor enter at a bottom- You will be in the narrower -but 'safer' zone.
I am selling my allowed amount in this position starting tomorrow-
The ema line has reached an all-time high, is starting to turn- What the reader cannot see is that price is under the turn- else the ema would not show a weakness-
This turn lower also coincides closely with the action of the MACD indicator.
For the purpose of illustrating the example- the macd histogram often indicates the divergence in buying and selling momentum by the height and distance of the histogram bars above and below the ) line.
This is not always an absolute signal to exit or to Buy- but look at the crossover from the o lines - and look at the decreasing bars from the high of the histogram preceding- both above the 0 line and below-
I don't typically use this indicator- I generally rely on just moving averages and price-
but in terms of the Mutual Funds, weakness in the indicator and weakness in the ema/fund price suggests this may be a good time to lock in profits. The 'divergence' of the indicator can be easily misinterpreted- and price can rally long after the divergence is obviouView attachment 150001 s-
so ultimately price action is the #1 indicator.
The faster indicator captures the price swing off the turn at the low better than the slower indicator- but it comes at a price- more frequent signals that react to a minor price move that does not work out- This is similar to using a faster chart to capture a turn at the low end of a move, and finding that the fast chart can register more false moves- ahead of the slower time frame.
If the move succeeds, the faster move gives an earlier- lower priced entry. But it requires more times at Bat and more strike outs-
Babe Ruth was remembered for his home runs, not for all the times he struck out-
Indicators- like the MACD - may show when momentum is starting to decline- both buying and selling- As can be seen by the chart, Price can go much higher- even when the indicator suggests it should be going in the other direction-
In this present chart, indicators are bearish- the fast is sub 0 line, and the slower is near 0-
but price is moving higher at today's close-