You are using an out of date browser. It may not display this or other websites correctly.
You should upgrade or use an alternative browser.
You should upgrade or use an alternative browser.
long term position trading -primarily etf's-
- Thread starter sowterdad
- Start date
Had some cash clear today-Chart shows the TDIV pullback- a wider chart suggests greater upside potential-
Price gapped higher- consolidates- stop is raised to below the fill of the gap.

Market momentum seems to be holding- institutions playing catch up for this last qtr?
After work, Getting in just before the market close- I added to CURE by 50%. 120.58-Will give this room below the bottom of the channel 116. Initial position cost $90.88 (best gain)
Reentered PBE $49.33--This is the type of reentry to a prior position I intend to continue as a process- as long as the larger trend appears to be intact. I have been in this position several times earlier-
added to Baba- strictly an irresponsible but small momentum gamble.Initial entry was late
,but this smaller add- if stop hits- trade will be a scratch- out above average cost.
Last edited:
Had some cash clear today-
Market momentum seems to be holding- institutions playing catch up for this last qtr?
Getting in just before the market close- I added to CURE by 50%. 120.58
Reentered PBE $49.33
added to Baba- momentum gamble
Charts- Cure-

A different view-

TDIV-Technology dividend 100-PBE CHART-
tODAY'S REENTRY-

I believe this is a 2nd entry - caught an early entry off an oversold market-
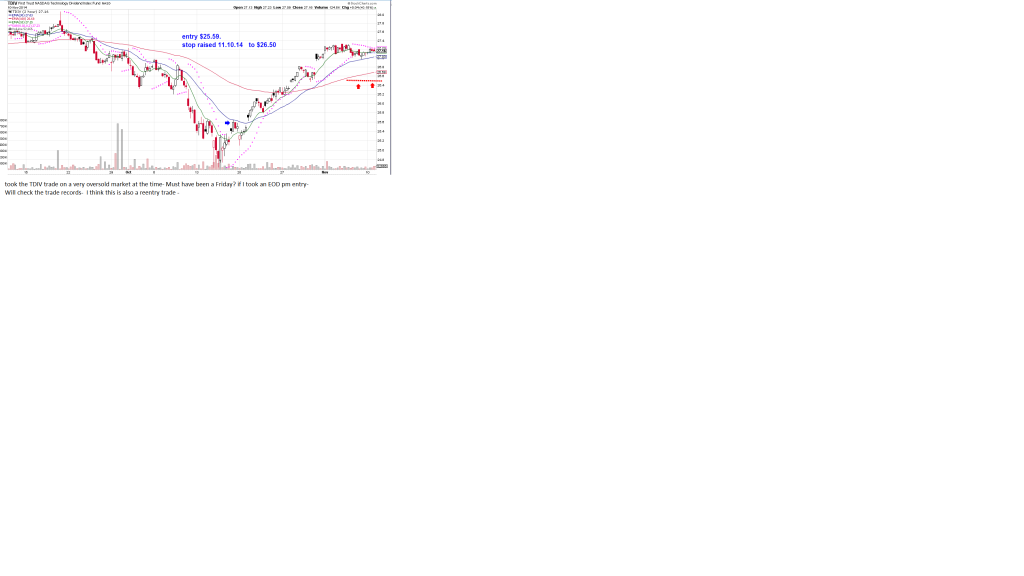
aLL THESE CHARTS LOOK ESSENTIALLY THE SAME-TDIV-Technology dividend 100-
I believe this is a 2nd entry - caught an early entry off an oversold market-
MARKET SOLD OFF ACROSS THE BOARDS- AND i WAS ABLE TO STEP IN-
i HAVE A LARGER POSITION IN DTN OUTSIDE OF THE TRADING ACCOUNT-
iT MAY NOT REPRESENT THE 'BEST' DIVIDEND FOCUSED- i ALSO HAVE A SMALLER POSITION IN VIG-
THOUGHT i'D GIVE DTN A RUN FOR THE MONEY THOUGH AS IT IS REBALANCED ACROSS SECTORS- AND ACTIVELY MANAGED- EVERY QUARTER THE POSITION IS EVALUATED- AND IF IT FAILS TO MEET THE CRITERIA- VALUE-MOMENTUM- ETC- IT IS REPLACED- iDEALLY- THE BEST DIVIDEND PAYERS IN EACH OF 10 SECTORS ARE INCLUDED- THIS PROVIDES DIVERSITY IN SECTORS- AND DIVIDEND GROWTH.

aLL THESE CHARTS LOOK ESSENTIALLY THE SAME-
MARKET SOLD OFF ACROSS THE BOARDS- AND i WAS ABLE TO STEP IN-
i HAVE A LARGER POSITION IN DTN OUTSIDE OF THE TRADING ACCOUNT-
iT MAY NOT REPRESENT THE 'BEST' DIVIDEND FOCUSED- i ALSO HAVE A SMALLER POSITION IN VIG-
THOUGHT i'D GIVE DTN A RUN FOR THE MONEY THOUGH AS IT IS REBALANCED ACROSS SECTORS- AND ACTIVELY MANAGED- EVERY QUARTER THE POSITION IS EVALUATED- AND IF IT FAILS TO MEET THE CRITERIA- VALUE-MOMENTUM- ETC- IT IS REPLACED- iDEALLY- THE BEST DIVIDEND PAYERS IN EACH OF 10 SECTORS ARE INCLUDED- THIS PROVIDES DIVERSITY IN SECTORS- AND DIVIDEND GROWTH.
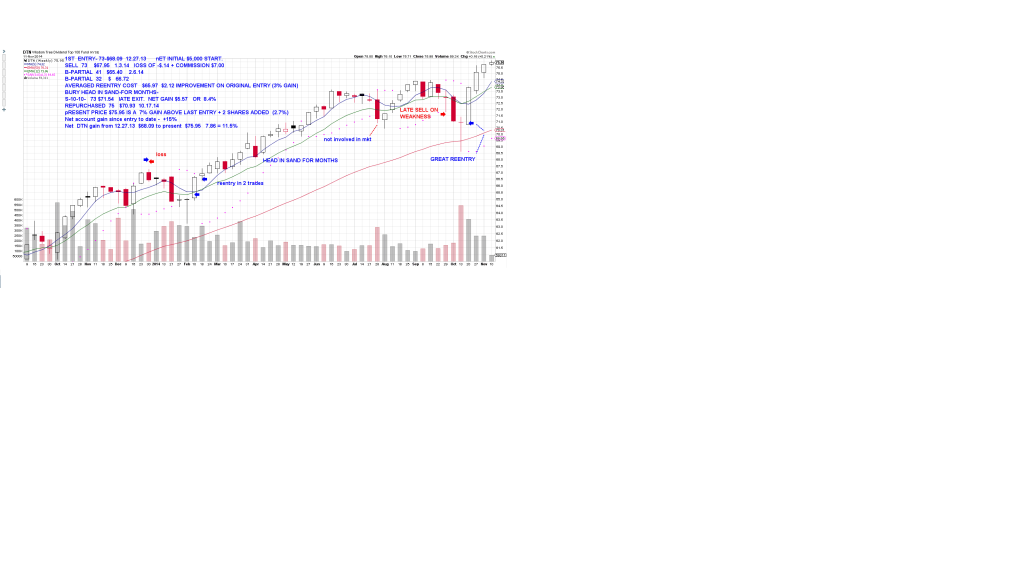
I'm trying to increase the chart- In this case, It's a weekly chart of DTN trades-
I felt DTN- a dividend etf would be relatively smooth-and "safer" to put some monies into for the longer term.
For some reason, my stockcharts chart does not reflect the initial prices I first bought and sold out almost a year ago-In December I made the 1st purchase-The goal was to simply "invest"- $5k in this one fund in a totally separate Roth account-
I think I purchased at a high-$68.09 momentum was up - looked good- and sold in under a week as price started to decline- $67.95 at a small loss - I went to the sidelines in this account- repurchased in Feb following a pullback- 2 separate trades a week apart $65.40, $66.72 This repurchase on the pullback gave a nice % improvement to my initial entry.still just 73 shares-
I buried my head in the sand- for the following months- and missed the August drama and trauma in the
market and the pullback- I didn't plan on being active in DTN- but the late September sell off saw DTN go down and I sold and then reentered a bit lower- off the bottom area- added a couple of shares- and price has since moved up higher-
I also received dividends monthly from the investment- not much $10- $14.00 it appears-but that adds up to being able to purchase an additional share-now and then.
For an Investment- I was willing to let DTN and the market give me what it would-over the course of time-
How many trading the SPY exceeded 50% gains in their accounts over the prior 2 year runs Spy delivered?
The initial Buy was poor- I think I had a lot going on with work and schedule- Wanted to not fight the market- just go with it and it'll be fine- As i try to recall, I think I was aggravated to see my momentum breakout trade falter and start to weaken- I wasn't watching or stalking the trade to get the better entry- Just said - I've got some money I haven't done anything with- Put it to use in a "safe" way- .
By selling quickly as the trade turned- I had a minor loss- and decided i would learn some patience and i waited- Finally, the turn came in Feb- and after a sharp sell-off- I entered with a partial and a week later added the remainder back-
Then I buried my head in the sands- along with the trading account- and let it ride- Including August-
I think i did finally move a stop up to my entry cost at some point-
i missed some substantial opportunities to have taken advantage of the typical market pullbacks though- Notably in August and again in later September- I did catch the end of the decline- exited and reentered as i awoke from my hibernation and got involved again.
I was able to Buy a few more shares at a lower price- but-in hindsight- i could have exited several % higher as price broke down- ...Always 20-20-after the fact.LOL!
Here is the point- i did not take the best advantage of the swings in the market- but I have a 15% return YTD- and if i had stayed the course on the initial entry, it would be 11% YTD-
I'm using this not well executed timing as having made a 4% cash improvement - which translates to a 36% improvement in returns YTD- Over time- If that can be repeated- it could make a profound difference in profits over a decade or two- Additionally- the use of a stop-loss reduces Risk - unless it is a whipsaw condition-
The other reason for the good return were the reentry dates- I was not using a weekly chart to watch the pullbacks for a reentry- The faster time frame chart offered me better entry confirmation- that happened to work out in my favor-
As Alan Farley pointed out in a 2003 video I watched -again- recently-
The absolute best entry to take is the entry that is closer to your stop.
Why? because with a very low amount to Risk you can be wrong - but step back in because the 1st loss or two is minor and gives you more chances at bat.
it is one thing to follow and look for an early entry with a faster chart- But for a position trade-One should not be focused on the ups and downs of a daily chart-Conversely, one should recognize when price is extended- as it appears to be now. A weekly chart gives a good overview- The daily chart really shows how far price has climbed- $75 looks to be a good stop on the daily- $74.50 on the weekly.