You are using an out of date browser. It may not display this or other websites correctly.
You should upgrade or use an alternative browser.
You should upgrade or use an alternative browser.
Long-term and Short-term Setups
- Thread starter TriciaWilson
- Start date
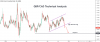
EUR/GBP Technical Analysis
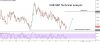
~~ The counter has been in a steady decline for the last 3 months.
~~ Now, it has hit a strong support level which could trigger some profit booking.
~~ Further, the stochastic indicator has given a buy signal by crossing over from the oversold zone.
~~ Hence, we expect the pair to be bullish in the short-term.
~~ The counter has been in a steady decline for the last 3 months.
~~ Now, it has hit a strong support level which could trigger some profit booking.
~~ Further, the stochastic indicator has given a buy signal by crossing over from the oversold zone.
~~ Hence, we expect the pair to be bullish in the short-term.
Attachments
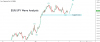
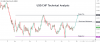
USD/CAD Technical Analysis
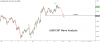
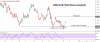
~~ The counter is currently hovering around long-term support of 1.3000.
~~ Though the price action has been able to marginally breakdown, it is not able to follow through.
~~ Further, the stochastic indicator has made a bullish crossover from the oversold zone in the 8-h chart.
~~ Hence, we expect the bulls to push the pair to higher levels from here.
~~ The counter is currently hovering around long-term support of 1.3000.
~~ Though the price action has been able to marginally breakdown, it is not able to follow through.
~~ Further, the stochastic indicator has made a bullish crossover from the oversold zone in the 8-h chart.
~~ Hence, we expect the bulls to push the pair to higher levels from here.
Attachments
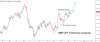
GBP/JPY Technical Analysis
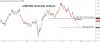
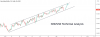
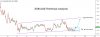
~~ The counter has been in an ascending triangle formation.
~~ Now, the range is narrowing and the pair is in a make or break situation.
~~ We expect the pair to render a bullish breakout, however, we advise traders to go long only above 140.341.
~~ The counter has been in an ascending triangle formation.
~~ Now, the range is narrowing and the pair is in a make or break situation.
~~ We expect the pair to render a bullish breakout, however, we advise traders to go long only above 140.341.