You are using an out of date browser. It may not display this or other websites correctly.
You should upgrade or use an alternative browser.
You should upgrade or use an alternative browser.
Long-term and Short-term Setups
- Thread starter TriciaWilson
- Start date
EUR/CHF Technical Analysis
~~ The counter has formed a dragon pattern.
~~ In a downtrend, it made a 38% retracement from the low and then rendered a false breakout.
~~ Further, it is on the verge of breaking out the trendline (a break validates it).
~~ Hence, we advise traders to be long in the counter once it crosses 1.730.
~~ The counter has formed a dragon pattern.
~~ In a downtrend, it made a 38% retracement from the low and then rendered a false breakout.
~~ Further, it is on the verge of breaking out the trendline (a break validates it).
~~ Hence, we advise traders to be long in the counter once it crosses 1.730.
Attachments
USD/CHF Wave Analysis
~~ The counter has been in a downtrend since the start of this year.
~~ The price was consolidating in a narrow for the last few months which could be interpreted as wave 4 of Elliott wave.
~~ Now it is on the brink of rendering a bearish breakout.
~~ We expect it to breakdown and complete wave 5.
~~ The counter has been in a downtrend since the start of this year.
~~ The price was consolidating in a narrow for the last few months which could be interpreted as wave 4 of Elliott wave.
~~ Now it is on the brink of rendering a bearish breakout.
~~ We expect it to breakdown and complete wave 5.
Attachments
Crude Oil Wave Analysis
~~ The strong upmove from below zero levels in the crude oil was consolidating for the last few months.
~~ It could be interpreted as wave 4 of Elliot wave which also resembles a bullish flag pattern.
~~ We expect the pair to be strongly bullish after it crosses the resistance at 41.90.
~~ The strong upmove from below zero levels in the crude oil was consolidating for the last few months.
~~ It could be interpreted as wave 4 of Elliot wave which also resembles a bullish flag pattern.
~~ We expect the pair to be strongly bullish after it crosses the resistance at 41.90.
Attachments
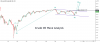
CAD/CHF Technical Analysis
~~ The counter has consolidated and formed a base at the lower.
~~ It could be interpreted as multiple inverted and shoulder patterns.
~~ Now, the pattern has broken out and hence we expect the pair to be bullish in the short-term.
~~ The counter has consolidated and formed a base at the lower.
~~ It could be interpreted as multiple inverted and shoulder patterns.
~~ Now, the pattern has broken out and hence we expect the pair to be bullish in the short-term.
Attachments
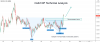
EUR/USD Technical Analysis
- The hope (virus cure) rally has fizzled out.
- The pair hit the rang top, formed a head and shoulder pattern, and has broken down now.
- We expect the pair to hit the lower end of the range in the next few sessions.
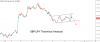
GBP/JPY Technical Analysis
~~ The counter has been consolidating within a bearish flag pattern after the deep slide.
~~ It hit the upper parallel of the pattern and then made a strong sell-off.
~~ We expect the pair to move lower and break down in the short-term.
~~ The counter has been consolidating within a bearish flag pattern after the deep slide.
~~ It hit the upper parallel of the pattern and then made a strong sell-off.
~~ We expect the pair to move lower and break down in the short-term.
Attachments
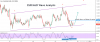
USD/JPY Technical Analysis
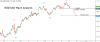
~~ USD/JPY made a strong impulse move two weeks before.
~~ But the rally fizzled out at the high and since then the pair is retracing its move.
~~ Now, it has found support around the 103.7 mark.
~~ A move beyond the resistance 104.2 can invite bulls once again in this counter and hence we advise traders to go long as soon as the pair breaks above it.
~~ USD/JPY made a strong impulse move two weeks before.
~~ But the rally fizzled out at the high and since then the pair is retracing its move.
~~ Now, it has found support around the 103.7 mark.
~~ A move beyond the resistance 104.2 can invite bulls once again in this counter and hence we advise traders to go long as soon as the pair breaks above it.