You are using an out of date browser. It may not display this or other websites correctly.
You should upgrade or use an alternative browser.
You should upgrade or use an alternative browser.
Long-term and Short-term Setups
- Thread starter TriciaWilson
- Start date
AUD/CHF Wave Analysis
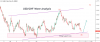
~~ As we suggested earlier, the counter is currently in an ABC and has moved down significantly.
~~ Now, it is forming a triangle in the short-term charts.
~~ We advise our users to either sell at the resistance of 0.665 or when the price breaks down below 0.651.
~~ As we suggested earlier, the counter is currently in an ABC and has moved down significantly.
~~ Now, it is forming a triangle in the short-term charts.
~~ We advise our users to either sell at the resistance of 0.665 or when the price breaks down below 0.651.
Attachments
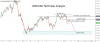
EUR/JPY Technical Analysis
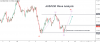
~~ The counter has made a retest of the broken head and shoulder neckline.
~~ It has made the retracement in the form of a bearish flag and has broken down from it.
~~ Further, it has crossed critical support of 123.9 and hence we expect the pair to be bearish in the short-term.
~~ The counter has made a retest of the broken head and shoulder neckline.
~~ It has made the retracement in the form of a bearish flag and has broken down from it.
~~ Further, it has crossed critical support of 123.9 and hence we expect the pair to be bearish in the short-term.
Attachments
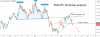
NZD/USD Technical Analysis
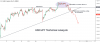
~~ The counter has formed a double top pattern in the short-term.
~~ Further, it has broken down with a strong bearish candle.
~~ The formation interpreted a solid distribution around 0.667 levels.
~~ Hence, we expect the pair to slide down from here.
~~ The counter has formed a double top pattern in the short-term.
~~ Further, it has broken down with a strong bearish candle.
~~ The formation interpreted a solid distribution around 0.667 levels.
~~ Hence, we expect the pair to slide down from here.
Attachments
I want to help out retail traders.
ha ha
 show your tax returns to begin with..
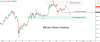
EUR/USD Wave Analysis
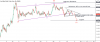
~~ The counter is currently forming an ABC correction.
~~ It is now in its second leg which is of the wxy wave form.
~~ Now, the pair is making a bullish move to complete the wave y and hence we expect the pair to be bullish in the near-term.
~~ The counter is currently forming an ABC correction.
~~ It is now in its second leg which is of the wxy wave form.
~~ Now, the pair is making a bullish move to complete the wave y and hence we expect the pair to be bullish in the near-term.
Attachments
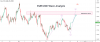

EUR/USD Wave Analysis
~~ The counter is currently forming an ABC correction.
~~ It is now in its second leg which is of the wxy wave form.
~~ Now, the pair is making a bullish move to complete the wave y and hence we expect the pair to be bullish in the near-term.
Day chart shows it is moving messily between 1.16 & 1.20 level.
But there are day trading opportunities even though it is ranging between
1.16 and 1.20 level.
Last edited: