You are using an out of date browser. It may not display this or other websites correctly.
You should upgrade or use an alternative browser.
You should upgrade or use an alternative browser.
Learning to read Price Action with P&F Charting
- Thread starter HolyGrail
- Start date
dow

dow.
end of day data
box size 40 points.
3 box reversal.hilo data plot.ie the chart prints a new box if the high or the low is 40 points away.it will take 120 points,approx 2% to change column.
notice how the downtrend line keeps inthe price action.this is a 45 degree downtrendline.the chart does not become bullish until 11800 area is broken.this is in p/f terms.last p/f signal was double-bottom breakout at 11520 area.included are some vertical counts.this give you an idea of price targets that could be achieved
eurodollar:got a downside vertical count that has just got activated

holygrail....
it will be alot cheaper the next time you travel to italy
it will be alot cheaper the next time you travel to italy
Quote from dentist007:
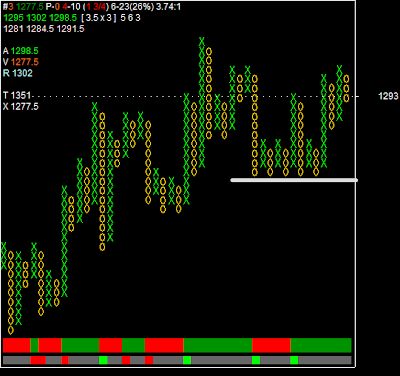
s&p 500.15 point box size.by 3 reversal
chart is displayed with vertical counts calculated by updata
take note of the latest count.this is a longer term chart.however,it is looking like we will revisit 2002/2003 lows.looking like nuclear war out there
note how the targets are only created off completed columns, updata guys are really on top of their game
Quote from yayt:
Dentist, and others, what has been your experience day trading using PnF?
not sure what this question is supposed to mean?
that's all I use in day trading is P&F (though I do glance at a couple different styles of charts for other things)
and 90% of all my trading is day trading
P&F can work perfectly fine for day trading though if that is what you are asking
Quote from yayt:
Dentist, allow me to thank you for giving me the name of this amazing piece of software!
If you are looking for something a bit cheaper you can check out IRT
updataTA is the best P&F software out there at the moment but they are not based in the US either...
IRT has implemented a lot of great P&F features at request and they are continually updating
IRT is the best MP software (which I suppose isn't relevant in this thread) and does the second best job at P&F...I should give the ole IMO of course
Quote from yayt:
Hey all,
Does anyone know about the accuracy of point and figure charts on stockcharts.com? I want to use a stock scanner to look for stocks at a double bottom (to buy off support or to sell short off resistance) but am hesitant to pay for the service unless it is accurate.
I remember some posts before about some inconsistencies between stockcharts.com and other services. Can anyone provide further insight?
stockcharts.com is perfectly fine...just realize what data it is using (they use daily data I believe)
if you are looking for the most accurate (detailed) P&F charts you will want to use use raw tick data, however, that does not make daily data any less reliable or effective when it comes to P&F
this is just Bullstick!!!!
this isn't the first time either.
As of now, all my longs except 2 are down substantually for the day and ALL my short stocks are up for the day. (about 15 of each). No wonder most traders are bald
I've got to do a lot better job of analysing the stocks than just good breakout patterns.
this isn't the first time either.
As of now, all my longs except 2 are down substantually for the day and ALL my short stocks are up for the day. (about 15 of each). No wonder most traders are bald
I've got to do a lot better job of analysing the stocks than just good breakout patterns.