
You are using an out of date browser. It may not display this or other websites correctly.
You should upgrade or use an alternative browser.
You should upgrade or use an alternative browser.
Just want to vent about a trade
- Thread starter heavenskrow
- Start date


Take a look at the Tradestation & Think or Swim chart - price did not pierce the prior reaction high at 162 20/32 like it did on your chart.
I would take this up with your broker and ask them to negate your stop out. Good luck.
Tradestation
View attachment 219163
Think or Swim
View attachment 219167
I don't think he implied it was a "stop out". Thus, when he said he "got out"...he may be talking about a market order. Thus, he just dumped the position there.
wrbtrader
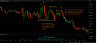
%%Just want to vent. I thought I was trading it well(until I scratched), but maybe some of you might have a better opinion on how a pro or "elite trader" would have managed this trade better.
My initial entry is the peak for intraday near US market open noted by white line.
I enter and market takes off in my direction, I'm happy about my entry.
Now I focus on "managing the trade"
From initial entry, market came back so I decided to add and sure enough it went in my direction again, so I was deciding to sell my first position at target white line and let the other ride longer depending on market action post target.
Unfortunately, it bounces again before reaching target and it retested the same exact prior peak, even a little past my add area. I thus got out of all my positions as that is a rule that I have that if the market ever comes back to where I add(I like to scale in), I get out of all positions. I listened to my rules, and after scratching on the trade, I see a reversal candle but I hesitate to get back short as psychologically, this market kept chopping back and forth and never reaching my target all session. After I throw in the towel at the short side, FINALLY the market decides to move and hit my original target during Asia session.
To all you professional traders(who do this for a living), what would you have done to better manage this trade?
View attachment 219137
I use colors like co magnum chart, but i use your /my more of moving averages, like yours.ALSO it looks like you are trading with the main trend last time i looked @ a 10 year bond chart, but double check that.ANY LOSS for me almost always means QQQ and or SPY, UPRO has changed from bull /200day trend to bear200 day trend or vice versa.I had a small profit accidently into a loss, TZA, past 7 or 14 days.
Good thing since , [TZA actually profits off short position on IWM=]i did not keep adding to it like i do UPRO type trends/investments.
IN other words i trade smaller on a chop=slop short position; than chop slop long which pays better dividends/trends better. ALSO even though floor trader$ use the word ''scratch''= its a loss; me, i dont like the word loss also,so i use the word business expence. I had planned on trading more short term, but still seldom do 'caus of what happened to my + your trade..........................................................................................................
The obvious answer is to use ultra bond contracts as a cross hedge to control your risk. This can also be done to protect a position, and improve your entry price (cost basis).
This is also known as "working an average price" or even "jobbing" a position.
So you have a stop price rule, OK.
This would go something like this.
Sell 3 ZB at ~6:45 (your original entry).
You keep playing the range. At the lows in the action you long 2 lots UB. When the market gets back near your entry you close them.
With this technique you're gonna short bonds outright, leg the BoB spread during the action, and then leg out into outright risk as the trade keeps working for you.
This way you established a good short position, and then improved it. Using this technique, your risk is high, then low (cross-hedged via BoB spread), then high again, etc.
This is a great way to trade rates. It allows you to be very bearish, slightly bearish, neutral, slightly bullish, or very bullish for each part of the trade. If you can read markets and price action, the advantage is obvious.
As an aside, this technique can be careful and slow (outright to hedged, to outright, etc.) or it can be a way to trade with extreme aggression.
This is because, a trader can put on a huge position further out in the curve, and then trade against it for stupid size all day long using ZB.
Rates traders love spreads, especially for daytrading.
This is fascinating -- I've thought about trading spreads between the equity indices but for some reason this never occurred to me. Any suggested reading for more about this specific UB/ZB stuff?
This is fascinating -- I've thought about trading spreads between the equity indices but for some reason this never occurred to me. Any suggested reading for more about this specific UB/ZB stuff?
Spread trading is not that easy anymore. Most of the products are kept in line by very sophisticated algos so you don't get major divergences. It's twice the comms and also hard to make money on.

This is fascinating -- I've thought about trading spreads between the equity indices but for some reason this never occurred to me. Any suggested reading for more about this specific UB/ZB stuff?
This idea is what the majority of professionals do. Professionals measure risk using volatility estimates of instruments, and the estimated maximum adverse move against a position.
By spreading related contracts, instruments that have (ideally) a statistical AND fundamental relation, you are stripping risk out of your trade. Think about the "disaster" or "worst case" scenario for the trade and you will see why huge money is flowing into these ideas. Vast amounts of capital can be deployed into spreads and in a much safer fashion than outright exposure. Institutions trade these for insane size (think 40m, 50m, 100m, and more!).
This site has all the ratios for rate futures spreads. (very useful for cross hedging)
https://www.cmegroup.com/trading/interest-rates/intercommodity-spread.html
If you are talking about trading equity index spreads, these are some I find useful
(using ThinkorSwim charting formulas)
40*/NQ-15*/YM (Nasdaq/Dow)
10*/YM-150*/RTY (Dow/Russell)
5*/NKD-50*/ES (Nikkei/ES)
20*/NQ-100*/ES << This one is the most effective cross hedge (intraday)
50*/ES-5*/YM << Very effective cross hedge (intraday)
There are so many index spreads it's crazy, ASX200/FTSE100, Eurostoxx50/KOSPI, NIKKEI 225/DOW, NASDAQ/FDAX, etc., etc.
Know that this is not some fringe thing. This is a smart idea, and can be amazingly profitable.
Also, spreads can be used to predict the performance of outright instruments.
Think about it like this. Relative value and relative performance comparisons are used throughout all of finance and markets.
If currency traders want to figure out if USD is strong, what do they do?
They look at spreads and USD spread against baskets, eg. USDX.
I read the chart as this, always easier to do after the fact, but chart patterns don't change, price not closing beyond pivots with continuation often suggests range bound or chop, another bite at the apple, longer term Bearish H&S.
The perception of the chart pattern changes although its the same pattern / same chart. Thus, its the reason why chart analysis is so much easier in hindsight instead of in real time when real money is on the line.
wrbtrader
should take some profit to secure yourself, depends on support levels or liquidity levels. Bookmap could have been a good help to see were buyers stack and to take some profit thereJust want to vent. I thought I was trading it well(until I scratched), but maybe some of you might have a better opinion on how a pro or "elite trader" would have managed this trade better.
My initial entry is the peak for intraday near US market open noted by white line.
I enter and market takes off in my direction, I'm happy about my entry.
Now I focus on "managing the trade"
From initial entry, market came back so I decided to add and sure enough it went in my direction again, so I was deciding to sell my first position at target white line and let the other ride longer depending on market action post target.
Unfortunately, it bounces again before reaching target and it retested the same exact prior peak, even a little past my add area. I thus got out of all my positions as that is a rule that I have that if the market ever comes back to where I add(I like to scale in), I get out of all positions. I listened to my rules, and after scratching on the trade, I see a reversal candle but I hesitate to get back short as psychologically, this market kept chopping back and forth and never reaching my target all session. After I throw in the towel at the short side, FINALLY the market decides to move and hit my original target during Asia session.
To all you professional traders(who do this for a living), what would you have done to better manage this trade?
View attachment 219137