You are using an out of date browser. It may not display this or other websites correctly.
You should upgrade or use an alternative browser.
You should upgrade or use an alternative browser.
Just buy dips on high volume
- Thread starter 1a2b3cppp
- Start date
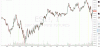
Alright, yellow line = no, green line = yes
I have no idea what happened around 7:15 because the volume overlaps with price.
Seriously?
In real-time your green or yellow line thingys would not have been recognized as you've marked. Just look at a few bars prior to each. How do you know in real time, the context of what a trade-able peak is?
You have a computerized way of backtesting your theory, I hope.
Possibly it should. I wasn't sure which candle it went with since the chart was so zoomed out. Price did ascend after that.1a2b3cppp, interesting. Question - why is your line between 7 and 7:15 yellow? It looked like a down day on big volume - shouldn't that be green? Thanks.
Precise. I mentioned this on page 2.Seriously?
In real-time your green or yellow line thingys would not have been recognized as you've marked. Just look at a few bars prior to each. How do you know in real time, the context of what a trade-able peak is?
You have a computerized way of backtesting your theory, I hope.
That's why you average down.