Why don't you use a chart without adjusted temperatures.
Because it would not be as accurate. Even Judith Curry concurs. Google it. How may times do I have to educate you on this?
Having worked with many of the scientists in question, I can say with certainty that there is no grand conspiracy to artificially warm the earth; rather, scientists are doing their best to interpret large datasets with numerous biases such as station moves, instrument changes, time of observation changes, urban heat island biases, and other so-called inhomogenities that have occurred over the last 150 years. Their methods may not be perfect, and are certainly not immune from critical analysis, but that critical analysis should start out from a position of assuming good faith and with an understanding of what exactly has been done.
This will be the first post in a three-part series examining adjustments in temperature data, with a specific focus on the U.S. land temperatures. This post will provide an overview of the adjustments done and their relative effect on temperatures. The second post will examine Time of Observation adjustments in more detail, using hourly data from the pristine U.S. Climate Reference Network (USCRN) to empirically demonstrate the potential bias introduced by different observation times. The final post will examine automated pairwise homogenization approaches in more detail, looking at how breakpoints are detected and how algorithms can tested to ensure that they are equally effective at removing both cooling and warming biases.
Why Adjust Temperatures?
There are a number of folks who question the need for adjustments at all. Why not just use raw temperatures, they ask, since those are pure and unadulterated? The problem is that (with the exception of the newly created Climate Reference Network), there is really no such thing as a pure and unadulterated temperature record. Temperature stations in the U.S. are mainly operated by volunteer observers (the
Cooperative Observer Network, or co-op stations for short). Many of these stations were set up in the late 1800s and early 1900s as part of a national network of weather stations, focused on measuring day-to-day changes in the weather rather than decadal-scale changes in the climate.
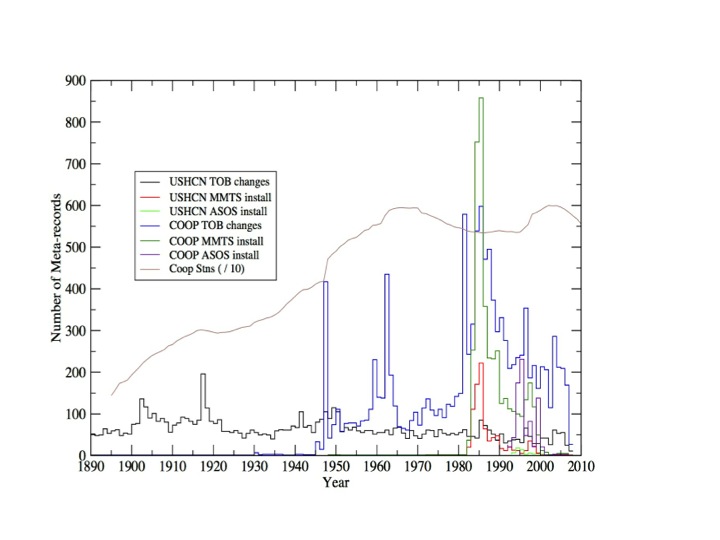
Figure 2. Documented time of observation changes and instrument changes by year in the co-op and USHCN station networks. Figure
courtesy of Claude Williams (NCDC).
Nearly every single station in the network in the network has been moved at least once over the last century, with many having 3 or more distinct moves. Most of the stations have changed from using liquid in glass thermometers (LiG) in
Stevenson screens to electronic
Minimum Maximum Temperature Systems(MMTS) or
Automated Surface Observing Systems (ASOS). Observation times have shifted from afternoon to morning at most stations since 1960, as part of an effort by the National Weather Service to improve precipitation measurements.
All of these changes introduce (non-random) systemic biases into the network. For example, MMTS sensors tend to read maximum daily temperatures about 0.5 C colder than LiG thermometers at the same location. There is a
very obvious cooling bias in the record associated with the conversion of most co-op stations from LiG to MMTS in the 1980s, and even folks deeply skeptical of the temperature network like Anthony Watts and his coauthors add an explicit correction for this in their paper.
https://judithcurry.com/2014/07/07/understanding-adjustments-to-temperature-data/