Is there an indicator that “normalizes” pullback signals against varying trend strengths?

...don't suppose you'd post an example chart or two?
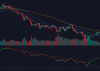
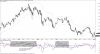
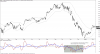
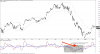
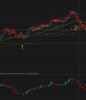
Just two quick examples. Most of it can be seen without any indicators but I find flipping through hundreds of stocks, it just makes it pop out quicker so I get through it quicker. You'll notice most price will stay within the bands. Not saying go and short a keltner high touch, but I'm not looking for an entry at that point either.

I'm only paying attention to trend reversals and first/2nd swings on trends. Mostly watching the consolidation/pullback for an entry.

Keltner Statistics • The Blog of Adam H Grimes
 

Attachments

  • Example1.png
    Example1.png
    52.9 KB · Views: 92
  • example 2.png
    example 2.png
    50.9 KB · Views: 82
Thanks Daniel! Could you elaborate on that relationship a bit, and what you like to see happen to confirm the price isn't going to obliterate an MA (eg)? I'm not familiar with this indicator and just looking at it for the first time here.

1. Holds, cumulative delta no momentum
2. Breaks, cumulative delta has momentum
 

Attachments

  • example.JPG
    example.JPG
    90.2 KB · Views: 84
1. Holds, cumulative delta no momentum
2. Breaks, cumulative delta has momentum

Ok! I happened to be staring at this chart and added the CDV and saw a pretty clear early indicator... by the time the price actually tested the trend line the CDV was way out of whack, whereas the previous price touches corresponded with the CDV trend. As shown in attachment...

This could be quite useful! I will start studying this more, thanks much! =)
 

Attachments

  • Screen Shot 2020-10-30 at 9.13.36 AM.png
    Screen Shot 2020-10-30 at 9.13.36 AM.png
    73.5 KB · Views: 48
1. Holds, cumulative delta no momentum
2. Breaks, cumulative delta has momentum
PS Am I reading you right in the way I applied it to the chart? I wasn't super clear, that's just what I noticed on my chart in this case after using it for literally 1 min.. hah.
 
Ok! I happened to be staring at this chart and added the CDV and saw a pretty clear early indicator... by the time the price actually tested the trend line the CDV was way out of whack, whereas the previous price touches corresponded with the CDV trend. As shown in attachment...

This could be quite useful! I will start studying this more, thanks much! =)

Ok. I have never used it on forex. I thought forex didn't record volume. Maybe they based it on upticks, downticks. Is also fine. You are reading it right on the chart.
 
Does anyone know of a good indicator that "normalizes" pullback signals based on the context of the strength of the trend they occur in? I've noticed that trend strength and pullback depth are often inversely proportional to one another.

There must be a way to measure this relationship and predict what a reasonable pullback zone can be based on the strength, but I've never seen an indicator that takes this into account (I'm still new and still learning about the indicator landscape).

Most indicators I have seen are "ignorant" of the trend...

For example, a 20 period MA might be a great touchpoint for some pullbacks (ie if the trend strength is "just right") - but the price won't even glance it for others; for others still the price will blow right through it and touch the 50 MA!

Again there must be some way to balance these two forces and produce a "smart" pullback signal generator? In fact I assume one already exists and in my newbie-ness I just haven't found it yet...

One should by this method be able to anticipate what kind of depth to watch for (in theory).
%%
50dma/20dma/200 dma tends to work well.NOT predict; they call it weather forecasting/not weather prediction.
Focus on a few like SPY/spxs/QQQ helps...…...
QQQ is down more than average today,its below 50dma but above 200dma/that tells me a lot.
Discretion + again a focus on a few for years/helps...……………………………………...
Because price or temp is not predicted does not invalidate or make ignorant the thermometer or 50dma/comprehende??
 
I found another really cool example here - this one showing how well the CDV "held on" to a particular trend concept, while a moving average would break down (considerably).

You can see the trend moved from touching a 9 SMA, then broke up to a 20, and finally right up to a 50 all within a short time span, BUT I can pretty much draw a beautifully straight trend line on the CDV. Even that final big push only broke the CDV by one candle - and only a 5m candle at that (obviously tolerable... hehe).

Note: So far these kind of moves aren't showing themselves too often; inventing some kind of an alert system for this would be handy.... Pine Script is pretty easy generally so it might not be too tough. :)
 

Attachments

  • Screen Shot 2020-10-30 at 11.30.21 AM.png
    Screen Shot 2020-10-30 at 11.30.21 AM.png
    53 KB · Views: 49
For oscillator indicators, look at the work of John Ehlers. Specifically, Automatic Gain Control, the Fisher Transform, and Inverse Fisher Transform.
 
Back
Top