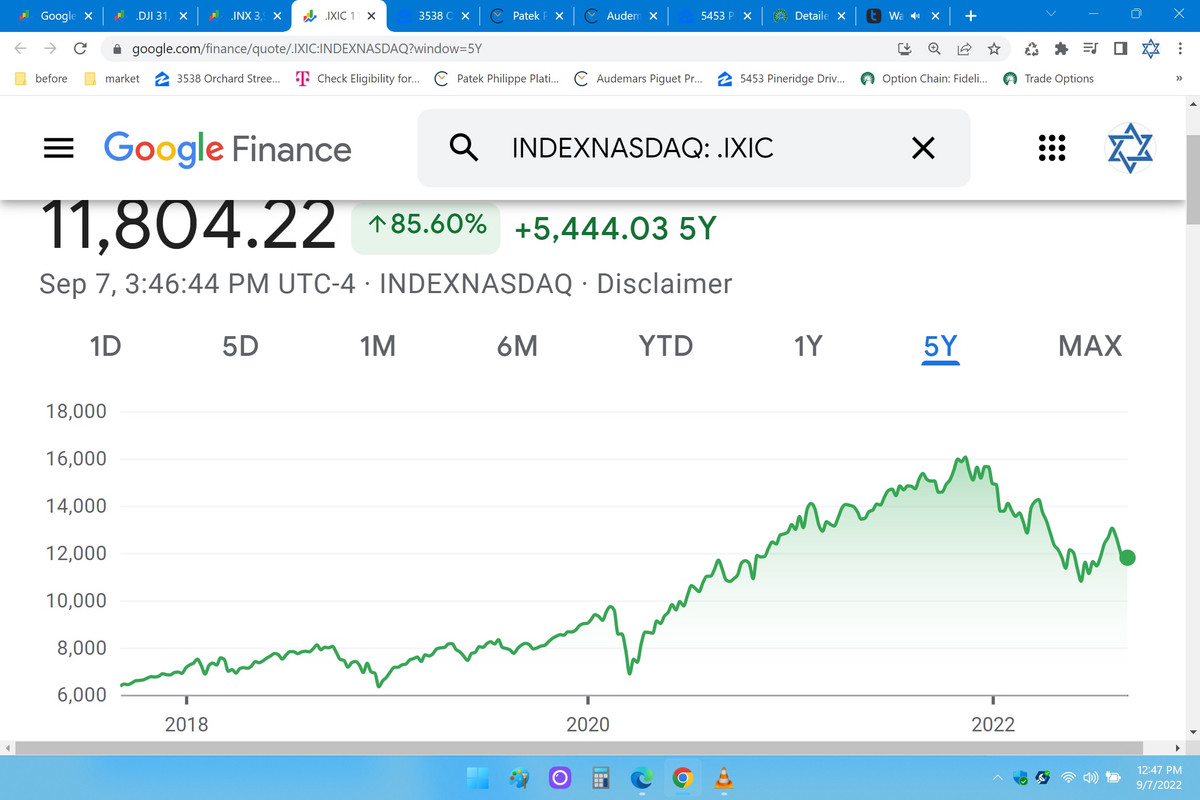
Is the Naz ultimately falling to 9500?

Looking at the chart , it seems as if that’s where the naz wants to go ( 9500).
Any thoughts?

i think you are being generous. maybe 8500 even. this price action is nothing like i have ever seen. the magnitude of these price declines mirror 1929 without exaggeration. the roll over really started 3/31/22 and of the Q1.

one might expect a retrace move toward 13,000 before it possibly rolls over harder. price will need to move beyond 13,500 to confirm a turnaround. currently....its trying to turn around to the upside but sellers are still in control as price continues to look for buyers.

here are my kindergarten drawings.
upload_2022-9-7_15-45-19.png
 

Attachments

  • upload_2022-9-7_15-44-43.png
    upload_2022-9-7_15-44-43.png
    85.9 KB · Views: 3
For the Nasdaq to drop to 9500....WW3 would need to happen, or another Coronavirus that is 4X stronger and more contagious and evades everything completely.

you may be a little "too certain about your feelings" (aka belief) that such things need to happen for price to reach those levels. market structure tends to prevail.


gfsdjgsdfjhkt5t.jpg

But I don't claim to have a crystal ball that looks that far, I only have a crystal ball that works intraday.
For the Nasdaq to drop to 9500....WW3 would need to happen, or another Coronavirus that is 4X stronger and more contagious and evades everything completely.
gfsdjgsdfjhkt5t.jpg

But I don't claim to have a crystal ball that looks that far, I only have a crystal ball that works intraday.
 
OK, you're using a log scale chart rather than a linear chart. I never use those charts. :)


And I only use Linear once in a while to see the overall picture. ditto for Line charts. Pure closing basis charts ......... good to take out the noise and see the real deal.
 
Another joker like Grand_Super_Cycle. Funny part is Grand_Super_Cycle is on Twitter and following this guy. They must have a little doomsday club.

It amazes me how all the perma-bears turn bullish at the peak of bear-market rallies. There is someone who is commenting on this thread who is one, and is magically making money with his 100 million dollar account no matter which way the market goes. His thesis is flapping in the breeze. Must be nice to have unlimited funds to trade with, because EVERYONE can just average-in with infinite money and profit that way.
 
Can we get some elliott wavers up in here, please?


Of course you can! But here's a good way to keep it simple wityhout even nedding all sorts of lines and wave numbers on your chart of the Nasdaq.

ALL financiual instruments have a tendency to correct into the vicinity of the previous 4th wave of one lesser degreee.

Now, ask all elliotticians here if they disagree with this statement. You will not be able to find anyone.

So, therefore on the chart just look for all previous 4th waves of lesser degree ... and we are going there .......................


1st 4th wave target is corona virus low of March 23rd , 2020 at 6978 which also happens to coincide with the golden ratio 61.8%

I expect when we get there there will be the usual loud calls for the BEAR is over as a rally that tears one anew one gets underway. Eventually it will fail and the BEAR will continue south to the next one
 
Can we get some elliott wavers up in here, please?

Sure, I can do it without a chart. You see, we are now entering the wave 3 of a down wave that started in Jan 2022, but had a bit of a rough time over the last months, so we are in an ABC wave which has not panned out, so we are now in a sub (1) (2) (3) (4) (5) wave series, leading into the first A wave you saw previously. Now that the A wave has successully completed the sub numbered waves listed above, we can now start the B wave.

Unfortunatley, there was some Fed speak, so now the wave 3 is interrupted by a B wave, which has sub (a) (b) (c) waves. Inside those sub abc waves there are (1) (2) (3) (4) (5) waves we need to complete first before we can break out of the main sub B wave. So now we are entering C wave of wave 3, which is...Uh oh, Putin ordered some missiles from North Korea, so now wave 3 is interrupted, so we now have a new subset of wave C, which will not be confirmed until the sub B wave theory confirms the B wave.

What's that, Putin is dead? All waves are broken, and the market goes north now. It's so easy, a caveman can do it.

You give me some good FA and I don't need charts. I'll play it blind.

 
Back
Top