
https://licensing.visualcapitalist.com/product/charted-satisfaction-with-democracy-in-26-countries/
Charted: Satisfaction With Democracy, in 26 Countries
July 15, 2024
By Bruno Venditti
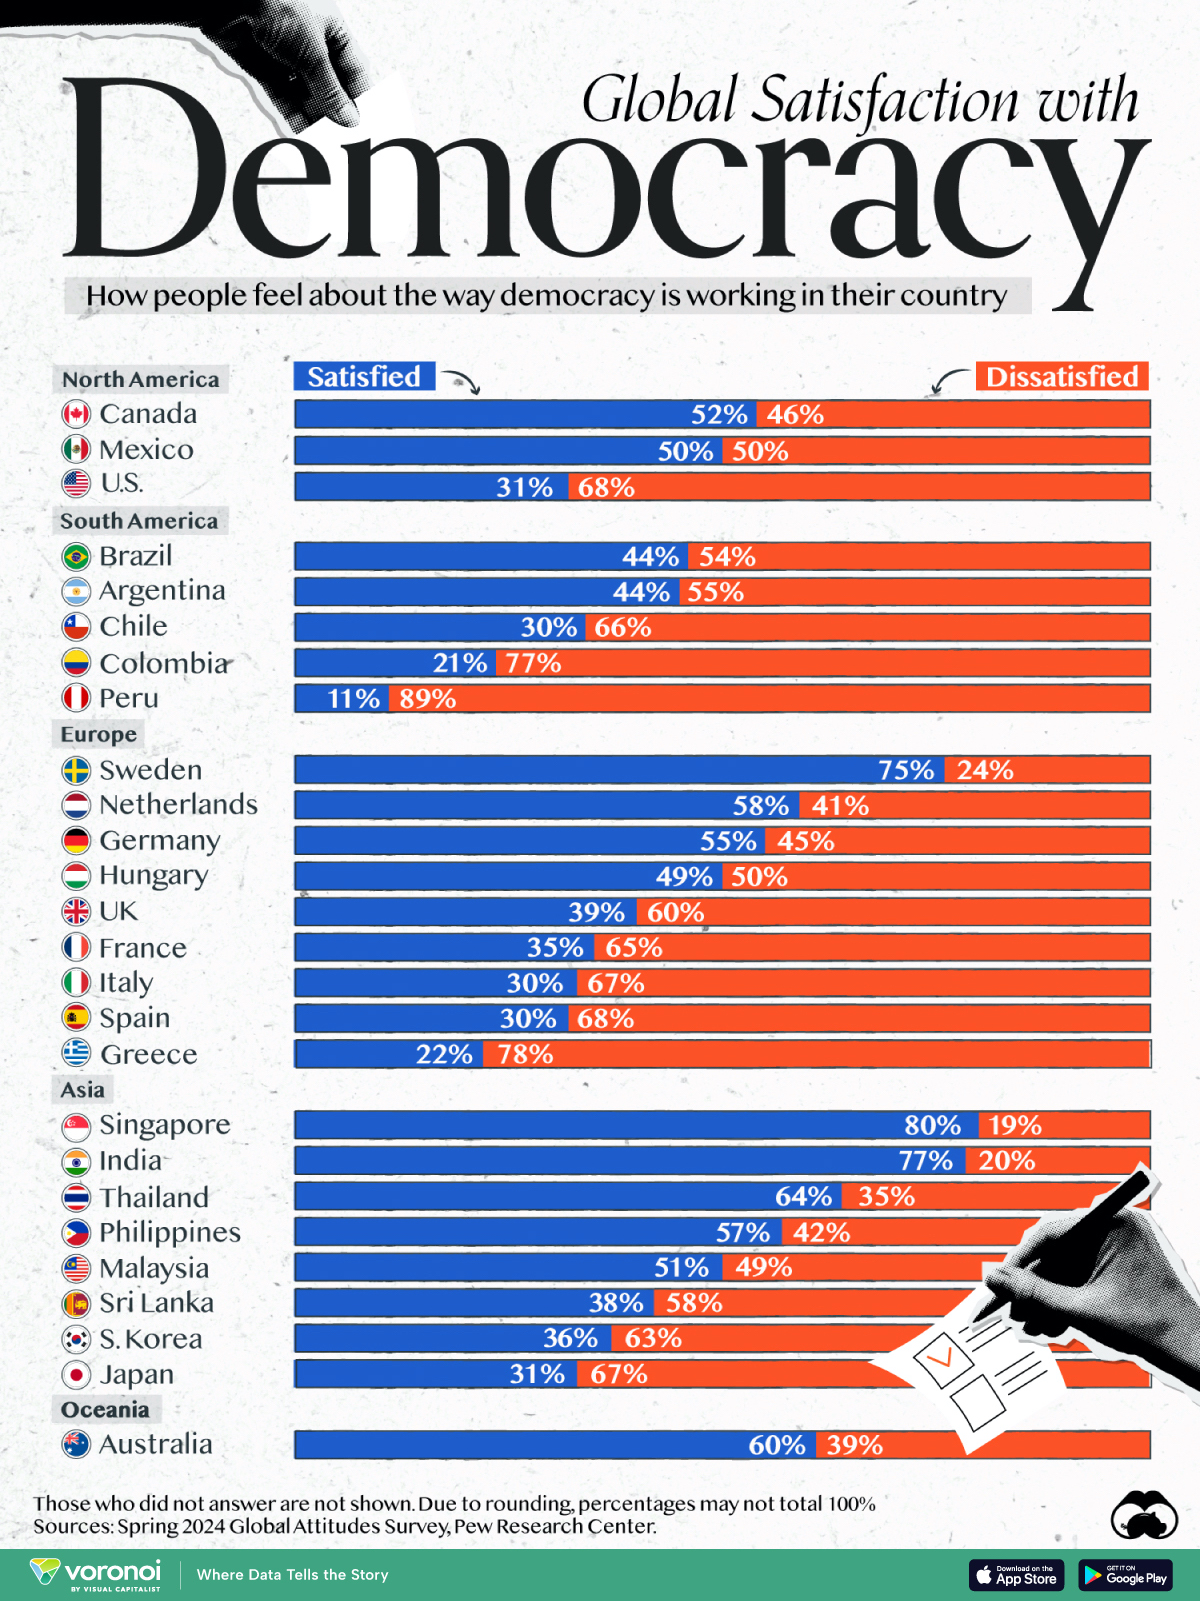
Almost half of the world’s population resides in countries that held or will hold executive or legislative elections in 2024. This prompts a closer look at how people feel about the way democracy is working in their respective nations.
This graphic shows the percentage of the population that is satisfied or dissatisfied with democracy in 26 countries. The data comes from the Pew Research Center.
Methodology
In 2024, the Pew Research Center conducted over 900 interviews in each country via telephone or face-to-face.
Respondents were asked, “How satisfied are you with the way democracy is working in [survey country] – very satisfied, somewhat satisfied, not too satisfied, or not at all satisfied?” Those who did not answer are excluded. Percentages may not total 100% due to rounding.
Decline in Satisfaction with Democracy
Satisfaction with democracy has declined in recent years, particularly in high-income nations. In nine out of the 12 countries where this question has been asked consistently, satisfaction levels are lower today than in 2021.
Country Satisfied (%) Dissatisfied (%)
U.S. 31 68
Canada 52 46
Mexico 50 50
Brazil 44 54
Argentina 44 55
Chile 30 66
Colombia 21 77
Peru 11 89
Sweden 75 24
Netherlands 58 41
Poland 57 39
Germany 55 45
Hungary 49 50
UK 39 60
France 35 65
Italy 30 67
Spain 30 68
Greece 22 78
Singapore 80 19
India 77 20
Thailand 64 35
Philippines 57 42
Malaysia 51 49
Sri Lanka 38 58
South Korea 36 63
Japan 31 67
Australia 60 39
Notably, six countries have seen a double-digit drop in satisfaction: Canada, Germany, Greece, South Korea, the United Kingdom, and the United States.
Regional Differences
Charted: Satisfaction With Democracy, in 26 Countries
July 15, 2024
By Bruno Venditti
Almost half of the world’s population resides in countries that held or will hold executive or legislative elections in 2024. This prompts a closer look at how people feel about the way democracy is working in their respective nations.
This graphic shows the percentage of the population that is satisfied or dissatisfied with democracy in 26 countries. The data comes from the Pew Research Center.
Methodology
In 2024, the Pew Research Center conducted over 900 interviews in each country via telephone or face-to-face.
Respondents were asked, “How satisfied are you with the way democracy is working in [survey country] – very satisfied, somewhat satisfied, not too satisfied, or not at all satisfied?” Those who did not answer are excluded. Percentages may not total 100% due to rounding.
Decline in Satisfaction with Democracy
Satisfaction with democracy has declined in recent years, particularly in high-income nations. In nine out of the 12 countries where this question has been asked consistently, satisfaction levels are lower today than in 2021.
Country Satisfied (%) Dissatisfied (%)
U.S. 31 68
Canada 52 46
Mexico 50 50
Brazil 44 54
Argentina 44 55
Chile 30 66
Colombia 21 77
Peru 11 89
Sweden 75 24
Netherlands 58 41
Poland 57 39
Germany 55 45
Hungary 49 50
UK 39 60
France 35 65
Italy 30 67
Spain 30 68
Greece 22 78
Singapore 80 19
India 77 20
Thailand 64 35
Philippines 57 42
Malaysia 51 49
Sri Lanka 38 58
South Korea 36 63
Japan 31 67
Australia 60 39
Notably, six countries have seen a double-digit drop in satisfaction: Canada, Germany, Greece, South Korea, the United Kingdom, and the United States.
Regional Differences
- Europe: 75% of Swedes are satisfied with their democracy, compared to just 22% in Greece.
- Asia-Pacific: More than three-quarters of Indians and Singaporeans are satisfied, whereas only 31% of Japanese are satisfied with their democracy.
- Latin America: About two-thirds or more of Chileans, Colombians, and Peruvians express negative views about their democracies.