You are using an out of date browser. It may not display this or other websites correctly.
You should upgrade or use an alternative browser.
You should upgrade or use an alternative browser.
Intraday estimation of daily volume
- Thread starter morganpbrown
- Start date
I remember listening to some interview and the guy (I think automated trader from SMB) was saying that they accumulate statistics on volume at every interval for every stock. So for example they can tell you avg volume for AAPL from 9:30 to 9:31 etc.The problem is that by the time I measure daily change in volume, the daily change in price is already baked in.
I remember listening to some interview and the guy (I think automated trader from SMB) was saying that they accumulate statistics on volume at every interval for every stock. So for example they can tell you avg volume for AAPL from 9:30 to 9:31 etc.
I am using ORATS and asked Matt if they have an attribute I could use. The people with the good data feeds and databases are best equipped for this kind of thing. I scrape option prices once or twice a day but don't want to do it every few minutes.
Bloomberg Time & Sales is most excellent and is used by many quants - there are toolkit extensions available for it to use in MatLab, S-Plus, etc..
But of course - you’re going to have to pay for a Bloomberg Professional Terminal
Heheh, if there is one thing I am most assuredly NOT...it is a professional trader!
 The annual subscription is probably more than my fun account.
$2,000 per month. They have all those customers for a reason, though. The quality of the data and the functionality and features are unmatched.
They made their bones on fixed income and then moved into equities with a more recent push into energy.
If you require accurate, real-time volume at price data you are going to have to pay for it one way or another. You can get delayed SPY exchange volume for free as you are aware.
They made their bones on fixed income and then moved into equities with a more recent push into energy.
If you require accurate, real-time volume at price data you are going to have to pay for it one way or another. You can get delayed SPY exchange volume for free as you are aware.
Heheh, if there is one thing I am most assuredly NOT...it is a professional trader!
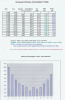
Average based on current day? I don’t think that’s what he needs, but cool feature. ESignal?Average volume by timeframe - in this case 5 minute eMini chart - colored bars at bottom cyan or magenta if above/below average or yellow if 125% above, Green/red plus signs for momo of average.
Based in the first however many minutes, you could estimate daily volume using the bottom half of this document. It’s a classic..
Yeah, this is pretty much what I had in mind. Do some data mining to estimate the reliability of predicting full-day volume from the historical N-minute volume, and Bob's your uncle. I'm feeling lazy right now, though!