Index Vol looks expensive

60 Day December contracts going for 29%. Mean 30 day realized vol since Jan is 22%.
upload_2022-10-14_15-44-9.png


If you were able to sell a 60DTE straddle at 29% every day for the past year and hedge EOD at 22% hedge vol till 30DTE, you'd have the following PnL stats (assuming margin of 2x straddle sell price):

upload_2022-10-14_15-40-54.png


upload_2022-10-14_15-41-33.png
 
The backtests we run show the rule of thumb that the market doesn't get the IV high enough or get the IV low enough. What that means, is during very volatile markets the IV does not go enough above HV and during non-volatile markets the IV does not go enough down towards a very low HV.

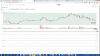
The bottom graph is historical volatility (HV) in magenta vs implied volatility (IV) in blue.
If you are selling IV you want HV to run less than IV. Currently, the IV is only slightly above HV.

84a5fe78c91a2a5f5e8b5b35c3c8229d.png

https://gyazo.com/84a5fe78c91a2a5f5e8b5b35c3c8229d

For example, EWY has IV running quite a bit above HV.
e18de0d0803437e65f6883c3c16743ad.png

https://gyazo.com/e18de0d0803437e65f6883c3c16743ad
 
The backtests we run show the rule of thumb that the market doesn't get the IV high enough or get the IV low enough. What that means, is during very volatile markets the IV does not go enough above HV and during non-volatile markets the IV does not go enough down towards a very low HV.

I take turns being amused by people thinking they can pop up an indicator or two and Beat The Market(tm) and annoyed by various furus commoditizing that belief and ripping people off with their Get Mega-Rich Sekrit Trading System(tm). The thought behind it seems to be "gosh, I must be brilliant" instead of "if it's real and this obvious, why wouldn't someone in the multi-billion-dollar finance industry have already set up a strategy and arbed every possible penny out of it? Maybe even back in the 1970s, much less these days?"

From a larger perspective, I have to wonder if even the most clever model achievable by retail traders is enough to provide sufficient alpha to overcome the friction. I'm definitely on the hunt for good quality tools - which includes having a useful model - but I don't think that's enough by itself.

(I've paused my ORATS sub for the moment - busy with something else - but I definitely consider it one of the good quality tools in my toolbox. Thanks for building it, Matt.)

For example, EWY has IV running quite a bit above HV.

upload_2022-10-14_18-50-54.png


I'm showing 25% for mean HV and ~32% for the IV - although it was a bit over 34% just a couple of days back. Can't see your HV value... is it much different? I'm still trying to establish a baseline for how much vol diff is enough to call it a reasonably good opportunity.
 
Last edited:
How long is your mean?

We use a modified Parkinson HV model that we call ORhv20d, HV 20 observations, and also a close to close HV. The ORhv1d to ORhv1000d is the range. The good thing with this observation is to get a one day historical volatility.

SPY ORhv1000d is 21.7% and close to close 1000d is 22.7% for a ratio of about 96%
f321dc98201317fb2adfe26df64f07e6.png

https://gyazo.com/f321dc98201317fb2adfe26df64f07e6


FSLR is an example of a stock that has ORhv higher than close to close at 109% ratio or 9% over. This would indicate that FSLR has a larger OHLC range than normal stocks vs close to close.
7efe9e7f45aa8fff619eacd66ccf4ca7.png


EFA is an example of an ETF that runs much less ORhv vs close to close, at 83%, indicating that the ORhv does not have as much intraday movement as close to close might predict.
22a301993f99c8bf1c78469159e08fb3.png

https://gyazo.com/22a301993f99c8bf1c78469159e08fb3
 

Attachments

  • upload_2022-10-16_17-26-47.png
    upload_2022-10-16_17-26-47.png
    187.2 KB · Views: 5
Back
Top