You are using an out of date browser. It may not display this or other websites correctly.
You should upgrade or use an alternative browser.
You should upgrade or use an alternative browser.
Increases in CO2 - Causes Cooling
- Thread starter jem
- Start date
Some here don't even know China IS doing anything. Or they oppose it anyway.good for china.... no one here is against china doing something about their real pollution problem.
in fact I am sure most of us think it is a good idea.
it the non validated by science agw scare crap we have a problem with.
"I hope the Chinese realzie it's not binding and has zero chance of being implemented. IOW, it's just like their undertaking."
are you confusing air pollution with co2/plant food?
Some here don't even know China IS doing anything. Or they oppose it anyway.
"I hope the Chinese realzie it's not binding and has zero chance of being implemented. IOW, it's just like their undertaking."
If you're shocked to hear China is all talk and no action on cutting carbon emissions, repeating pledges from the last ten years, raise your hand...
The Faux US-China Climate Deal
In the “historic” U.S.-China climate agreement this week, Beijing simply reiterated previously announced targets.
http://thediplomat.com/2014/11/the-faux-us-china-climate-deal/
The big headline coming out of the second summit between Chinese President Xi Jinping and U.S. President Barack Obama is a climate agreement the two sides reached about cutting carbon emissions in the coming decades. News stories have used sweeping language like the “historic climate change agreement” to describe the deal.
This seems to greatly exaggerate the significance of the deal, at least from the perspective of China. In fact, in the agreement Beijing simply reiterates commitments it had previously announced.
According to the White House, the agreement states that “The United States intends to achieve an economy-wide target of reducing its emissions by 26%-28% below its 2005 level in 2025 and to make best efforts to reduce its emissions by 28%. China intends to achieve the peaking of CO2 emissions around 2030 and to make best efforts to peak early and intends to increase the share of non-fossil fuels in primary energy consumption to around 20% by 2030.”
As numerous news accounts have pointed out, this means the U.S. will cut its emissions at a significantly faster rate than it had previously announced. According to the New York Times, under the new deal the U.S. will “double the pace of reduction it targeted for the period from 2005 to 2020.”
This is unimpressive compared to the commitments China made, according to the same article. “China’s pledge to reach peak carbon emissions by 2030, if not sooner, is even more remarkable. To reach that goal, Mr. Xi pledged that so-called clean energy sources, like solar power and windmills, would account for 20 percent of China’s total energy production by 2030,” the NYT article stated.
Actually, China does not appear to have committed itself to anything new in the agreement. Indeed, following an Obama speech on U.S. climate policy back in June, China outlined its own future emissions policy. Specifically, He Jiankun, chairman of China’s Advisory Committee on Climate Change, told a conference in Beijing that China would set an absolute cap on its CO2 emissions when it released its next five year plan in 2016. He refused, however, to say what that cap would be.
(More at above url)
Good to see that you admit that CO2 going into solution will lower PH. After all it's basic science.
The PH of the oceans is being reduced. Not evenly but as a whole.
Since you seem confused about this very basic thing (like the fact that CO2 is a greenhouse gas) you may want to see what NOAA says about it. You HAVE heard of NOAA right? LOL

http://www.pmel.noaa.gov/co2/story/Ocean Acidification
Two can play at this game.

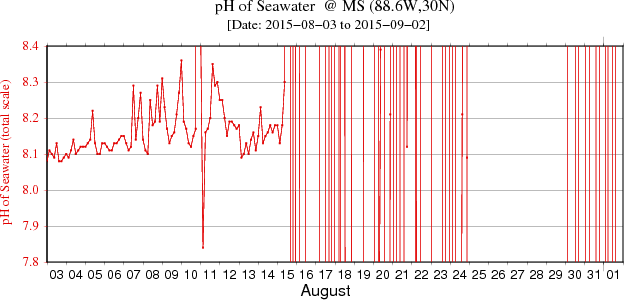
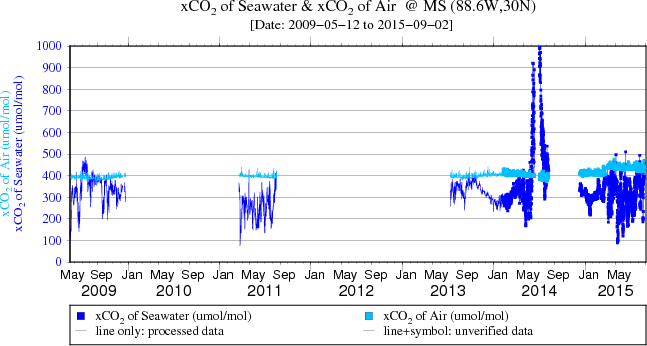
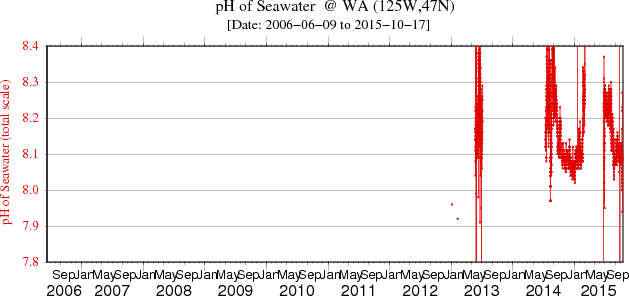
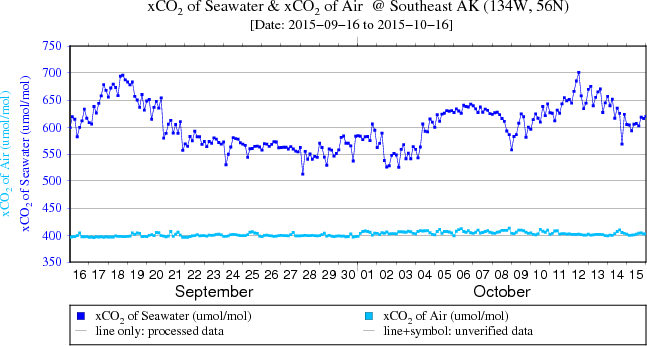
I don't think you want more of this. This is what you're up against! Good luck with that. And the mean is different at different places in the ocean. So you can't combine them. You have to keep sampling at each spot for many years. Then get the net drift up or down at that spot , if there is any, and average that drift with all the other drifts obtained over many years, to see if there is any significant mean drift up or down. That's not been done because the data hasn't been available, it may not be available with enough precision in my lifetime.
Below is your chart with the relevant error data for the regression lines. Note that the pCO2 data gives a slightly better fit to a parabola than to a straight line. This is from R.A. Feely's invited insert in "State of The Climate - 2007" review by Levinson, et al., BAMA, July 2008. After reading much of this very long article I realized for the first time what a state of utter chaos our understanding of climate is in. From Feely's insert pg. S58.: "...the time series data at Ocean Station Aloha shows an average change of approximately 0.02 units per decade in the northeast Pacific... The pH of ocean surface waters has already decreased by about 0.1 units from an average of about 8.21 to 8.10 since the beginning of the industrial revolution. "
I can't emphasize enough what difficulty drawing any conclusions re CO2 "acidification" from this particular data entails. First, a nice guy David Karl, and his students, with a boat, at the University of Hawaii collected the the pH data. That's probably some of the very best ocean pH data available for measurement in one spot over almost 20 years! It is one spot though, and ocean pH isn't exactly the same everywhere and there are many things that can affect it from one location to the next. (Ocean water is buffered so it never changes by much.) So now we have as good as we are going to get pH data, from a single spot in the Pacific ocean, near a volcano, over twenty years time. That data fits a down sloping line with a correlation coefficient of 0.26. It is being compared to pCO2 that actually fits a simple parabola better than the straight line shown. It fits the straight line with a correlation coefficient of 0.10!!! What to make of this? Note also that +- 0.02 pH units represent the typical standard deviation obtained from extremely careful, expert pH measurement under ideal conditions. This is the pH change that Feely says is associated with ten years of this aloha data! [one typically sees pH measurement expressed to only two figures for good reason.]
And finally how about that pH change for the entire ocean since the Industrial Revolution no less? Beckman invented the glass electrode in the first decade of the 20th century, so I don't doubt that Ocean pH was carefully measured then. But even if you measured it again in the exact same spot a hundred years later you haven't determined anything other than what the pH is a hundred years later at that spot. Any one who thinks that ocean pH changes by less than 0.1 unit no matter where you measure it, and that CO2 is the only thing affecting it, is a raving lunatic.. If anywhere there exists continuous measurement of ocean pH at even one spot from the industrial revolution to today it would be nice to see it! Perhaps the data was carefully estimated from tree rings.
Two can play at this game.
I don't think you want more of this. This is what you're up against! Good luck with that. And the mean is different at different places in the ocean. So you can't combine them. You have to keep sampling at each spot for many years. Then get the net drift up or down at that spot , if there is any, and average that drift with all the other drifts obtained over many years, to see if there is any significant mean drift up or down. That's not been done because the data hasn't been available, it may not be available with enough precision in my lifetime.
Below is your chart with the relevant error data for the regression lines. Note that the pCO2 data gives a slightly better fit to a parabola than to a straight line. This is from R.A. Feely's invited insert in "State of The Climate - 2007" review by Levinson, et al., BAMA, July 2008. After reading much of this very long article I realized for the first time what a state of utter chaos our understanding of climate is in. From Feely's insert pg. S58.: "...the time series data at Ocean Station Aloha shows an average change of approximately 0.02 units per decade in the northeast Pacific... The pH of ocean surface waters has already decreased by about 0.1 units from an average of about 8.21 to 8.10 since the beginning of the industrial revolution. "
I can't emphasize enough what difficulty drawing any conclusions re CO2 "acidification" from this particular data entails. First, a nice guy David Karl, and his students, with a boat, at the University of Hawaii collected the the pH data. That's probably some of the very best ocean pH data available for measurement in one spot over almost 20 years! It is one spot though, and ocean pH isn't exactly the same everywhere and there are many things that can affect it from one location to the next. (Ocean water is buffered so it never changes by much.) So now we have as good as we are going to get pH data, from a single spot in the Pacific ocean, near a volcano, over twenty years time. That data fits a down sloping line with a correlation coefficient of 0.26. It is being compared to pCO2 that actually fits a simple parabola better than the straight line shown. It fits the straight line with a correlation coefficient of 0.10!!! What to make of this? Note also that +- 0.02 pH units represent the typical standard deviation obtained from extremely careful, expert pH measurement under ideal conditions. This is the pH change that Feely says is associated with ten years of this aloha data! [one typically sees pH measurement expressed to only two figures for good reason.]
And finally how about that pH change for the entire ocean since the Industrial Revolution no less? Beckman invented the glass electrode in the first decade of the 20th century, so I don't doubt that Ocean pH was carefully measured then. But even if you measured it again in the exact same spot a hundred years later you haven't determined anything other than what the pH is a hundred years later at that spot. Any one who thinks that ocean pH changes by less than 0.1 unit no matter where you measure it, and that CO2 is the only thing affecting it, is a raving lunatic.. If anywhere there exists continuous measurement of ocean pH at even one spot from the industrial revolution to today it would be nice to see it! Perhaps the data was carefully estimated from tree rings.
View attachment 146484
So you post incomplete, short term and ultimately irrelevant charts and expect us to be impressed? Actually it just shows how desperate you must be to sound impressive and the result is that you just look foolish instead. You are trying too hard. Stop embarrassing yourself.
Nice touch with the "volcano" bit though. Although that of course is also irrelevant but pads your voluminous but empty spiel just a little.
Last edited:
So you post incomplete, short term and ultimately irrelevant charts and expect us to be impressed? Actually it just shows how desperate you must be to sound impressive and the result is that you just look foolish instead. You are trying too hard. Stop embarrassing yourself.
Nice touch with the "volcano" bit though. Although that of course is also irrelevant but pads your voluminous but empty spiel just a little.
On the contrary, what I showed you was real data chosen at random as apposed to the cherry picked single point data you provided. What I showed was the difficulty of obtaining good automated pH data in the ocean and the impossibility of measuring pH change directly in the ocean at a few points over a few decades and drawing accurate conclusions with regard to what affect CO2 is having. There is to much scatter, to little pH change, and too many contributors to pH. Similar problems haunt determination of anthropomorphic CO2 in the atmosphere by direct measurement. Natural sources and sinks completely swamp the anthro- contribution.
The best we can do is to fairly accurately estimate how much CO2 we put into the air from various sources. We can accurately measure the total amount of CO2 at any time at any one place. We can combine thousands of measurements to approximate the amount of CO2 in the atmosphere over time, and this somewhat correlates with our estimates of the CO2 we have put into the air, but the correlation is not nearly so good as I once thought it was. However, once we look at T vs. CO2 at a higher sampling rate the correlation gets surprisingly good! But Temperature leads CO2!, and the correlation between our estimates of anthropomorphic CO2 emissions and T gets worse. Something else is driving the CO2 up other than man. It is apparently temperature. At least this is consistent with observation, because the correlation, once phase is taken into account, is very good.
I will remind you again that correlation is a necessary but insufficient condition to prove cause. When you have oscillation, to recover a faithful record of a continuously varying signal (T, CO2) using discrete-in-time sampling, you must collect datum at at least twice the highest frequency component present in the signal. (The Nyquist criterion).
Only low frequencies are involved in atmospheric signals of T and CO2, so the Nyquist criterion is easily met. Unfortunately, early investigators ignored the nyquist requirement. This was for several reasons that made good sense to them at the time -- this goes back to their original hypothesis and the assumptions they made. Even though the necessary data existed fairly early on; the phase relationship between temperature and CO2 continued to be obscured by the time scales on which data was plotted and the choices made in defining data sets. Hence the major contribution of Salby and others, who were among the first to point this out. It would be hard to overestimate the importance of this, and it is for this reason that, ultimately, Salby and his colleagues who not only pointed out the need to observe phase, but actually delineated the phase relationship between T and CO2, should be given serious consideration for the Nobel Prize.
Temperature fluctuation is certainly driving CO2 fluctuation -- the phase relationships (for period~ decades) are consistent with this. There is very likely more than one driver of T on Earth, with one or two major drivers, and multiple minor ones. One of the minor components could be as simple as direct anthropomorphic thermal pollution.
This will be sorted out in due time. The phase relationship between T and the independent drivers of T will be an essential component in ultimately getting it right.
Someone get the waders. It's getting deep in here. And again with the fraud/fool Salby. You don't give up do you? Salby is a proven fraud that has twice lost his job due to fraud. Plus he is roundly derided as a fool by the science community. Yet you keep bringing him up. The fact that you think he should get the Nobel is laughable. To put it mildly.
And you also seem confused about the validity of atmospheric CO2 measurements.
It's pretty simple. You measure the CO2 in the air. One place up high is good enough but there are hundreds of places it is being measured. They all agree. And the reason they are going up is certainly due man. There is no question about it. That you suggest it something else is also laughable.
I don't know if you are truly this confused or if you are simply being deceitful but bottom line is that you are full of shit. Huge festering piles of it.
Last edited:
Someone get the waders. It's getting deep in here.
You're in over your head. Drinking your own shiat.