there is no consensus.... when the papers were examined on 41 out of 11000 argued that man made co2 caused warming... and I read a few of them... and those were all based on failed models.
you want to have credibility start producing work like this...
and ocean temps lead co2... not the other way around...
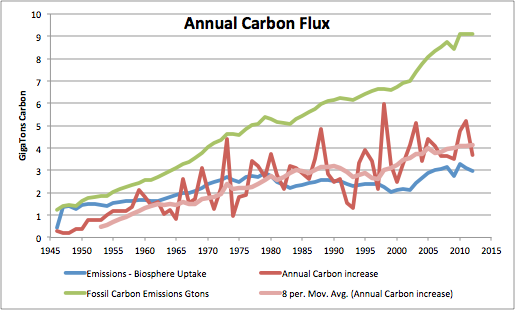
The shape of the annual carbon increase resembles the shape of the global sea surface temperature (HADSST3), especially after reliable CO2 measurements began by Keeling after March 1958. Several known events are visible. Counting backwards: the 1998 El Niño, the 1994-5 El Niño, Mt Pinatubo in 1991, the 1986-7 El Niño, Mt Ruiz in 1985, El Chichon eruption in 1982, the 1972-3 El Niño, etc. Every positive peak is an El Niño and every negative peak is associated with a major volcanic eruption.
As can be seen in Figure 1, there is no relationship between the fossil carbon emissions curve and the annual carbon increase curve. That is because all the fossil emissions carbon is taken up by the biosphere or by the oceans according to Henryâs Law, and then sequestered there. The carbon in the atmosphere is controlled by temperature. This has been described by Dr. Murry Salby in this presentations at Sydney and Hamburg. He compares the CO2 curve to the integral of temperature. Here, I am going the other way mathematically, taking the differential of the CO2 curve as temperature and comparing it to known temperature data, the HADSST3 data.
- See more at:
http://notrickszone.com/2013/10/08/...-co2-and-not-vice-versa/#sthash.gBOX3Ftl.dpuf
Jerm, you are a lying sack of shit.
Ninety-seven percent of climate scientists agree that climate-warming trends over the past century are very likely due to human activities,1and most of the leading scientific organizations worldwide have issued public statements endorsing this position. The following is a partial list of these organizations, along with links to their published statements and a selection of related resources.
AMERICAN SCIENTIFIC SOCIETIES
Statement on climate change from 18 scientific associations
"Observations throughout the world make it clear that climate change is occurring, and rigorous scientific research demonstrates that the greenhouse gases emitted by human activities are the primary driver." (2009)2
AAAS emblem
American Association for the Advancement of Science
"The scientific evidence is clear: global climate change caused by human activities is occurring now, and it is a growing threat to society." (2006)3
ACS emblem
American Chemical Society
"Comprehensive scientific assessments of our current and potential future climates clearly indicate that climate change is real, largely attributable to emissions from human activities, and potentially a very serious problem." (2004)4
AGU emblem
American Geophysical Union
"Humanâinduced climate change requires urgent action. Humanity is the major influence on the global climate change observed over the past 50 years. Rapid societal responses can significantly lessen negative outcomes." (Adopted 2003, revised and reaffirmed 2007, 2012, 2013)5
AMA emblem
American Medical Association
"Our AMA ... supports the findings of the Intergovernmental Panel on Climate Changeâs fourth assessment report and concurs with the scientific consensus that the Earth is undergoing adverse global climate change and that anthropogenic contributions are significant." (2013)6
AMS emblem
American Meteorological Society
"It is clear from extensive scientific evidence that the dominant cause of the rapid change in climate of the past half century is human-induced increases in the amount of atmospheric greenhouse gases, including carbon dioxide (CO2), chlorofluorocarbons, methane, and nitrous oxide." (2012)7
APS emblem
American Physical Society
"The evidence is incontrovertible: Global warming is occurring. If no mitigating actions are taken, significant disruptions in the Earthâs physical and ecological systems, social systems, security and human health are likely to occur. We must reduce emissions of greenhouse gases beginning now." (2007)8
GSA emblem
The Geological Society of America
"The Geological Society of America (GSA) concurs with assessments by the National Academies of Science (2005), the National Research Council (2006), and the Intergovernmental Panel on Climate Change (IPCC, 2007) that global climate has warmed and that human activities (mainly greenhouseâgas emissions) account for most of the warming since the middle 1900s." (2006; revised 2010)9
SCIENCE ACADEMIES
International academies: Joint statement
"Climate change is real. There will always be uncertainty in understanding a system as complex as the worldâs climate. However there is now strong evidence that significant global warming is occurring. The evidence comes from direct measurements of rising surface air temperatures and subsurface ocean temperatures and from phenomena such as increases in average global sea levels, retreating glaciers, and changes to many physical and biological systems. It is likely that most of the warming in recent decades can be attributed to human activities (IPCC 2001)." (2005, 11 international science academies)10
USNAS emblem
U.S. National Academy of Sciences
"The scientific understanding of climate change is now sufficiently clear to justify taking steps to reduce the amount of gree