IN THIS THREAD: IronFist learns (the elusive) PRICE ACTION

Quote from dandxg:

There is another component of PA that I haven't seen discussed on this thread. The velocity of PA. This is subjective and will take thousands of hours to master. I have been watching the indexes today too. Where is the velocity? There is none IMO. Just a drift back and forth. Now sure you can make money, but it's a lot easier done when you can a reversal on a lot of velocity, volume, and then PA makes HH, HL on good velocity. I just don't see that today so far. My 2 cents.

you are right. that is a thing i try to look at when entering a trade
 
Quote from fearless9:

WAS, the word is WAS...
"how strong the buying or selling WAS"

Uvol/dvol is just another piece of gathered information.
One more thing to process.

The question in day trading is what am I going to do if such and such occurs.

It is essential to think forward, not backwards.

By thinking forwards you can skew the odds into your favour.
Either price walks into the trap you have carefully prepared, or it eludes you until the next time that you chose to meet.

regards


f9
+1
 
Quote from nkhoi:

it seems everybody noticed that IR liked to long on the red candle. Was the candle red when you clicked the order?

At this level of development going long on red is too advanced and will lead to a wipe out.

Get the basics down first. There are too many other errors in the OP's trades so a good foundation needs to be laid.
 
Quote from IronFist:

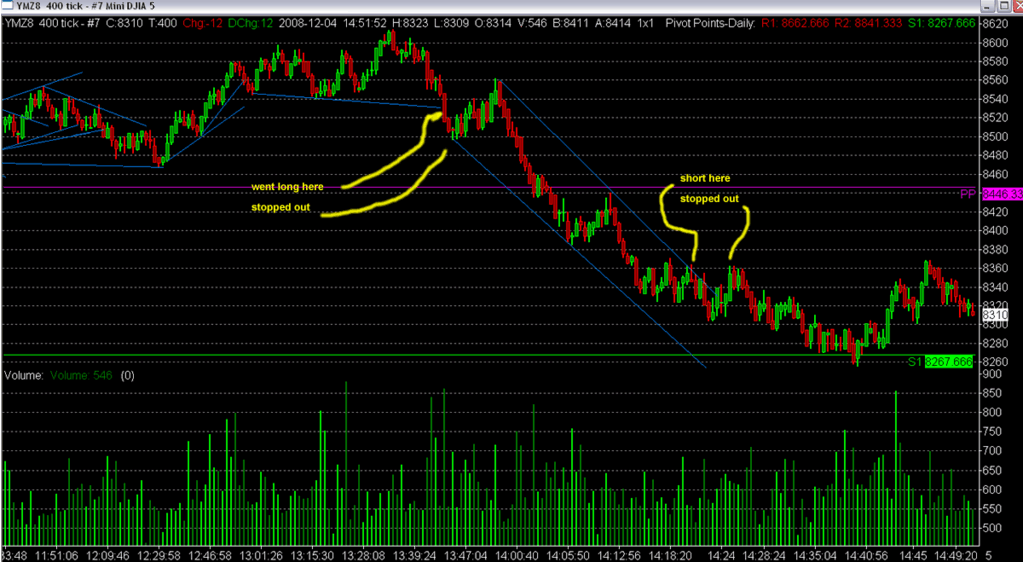
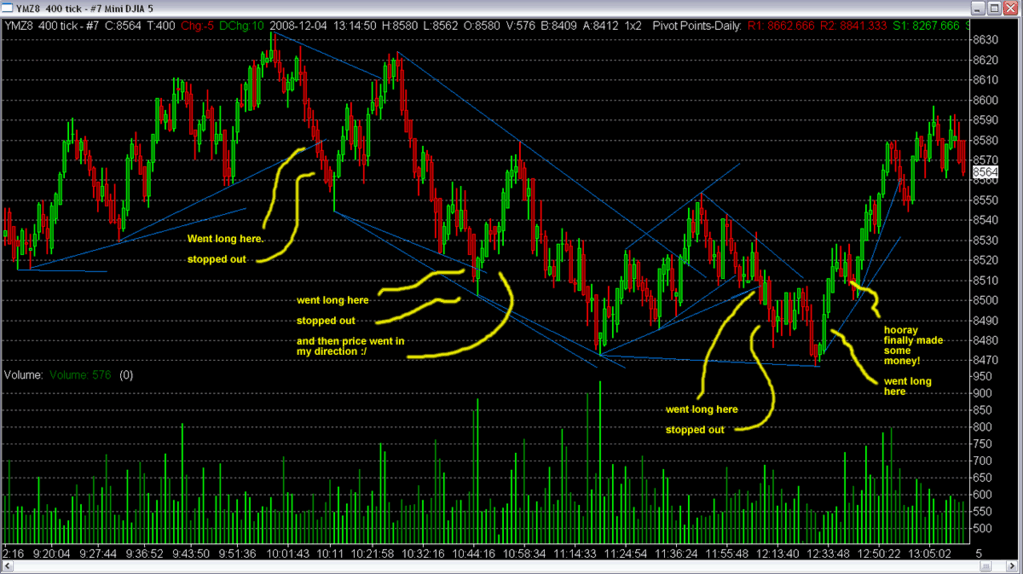
How bad I did today (12/4/08)

Morning:
12408ym1.gif


Afternoon:
12408ym2.gif


6 trades, 1 winner.

for most of your trades, looks like your stop wasn't patient (big) enough. Take another look if you had held on longer...
 
Quote from TraderZones:

for most of your trades, looks like your stop wasn't patient (big) enough. Take another look if you had held on longer...

Widening stops has more to do with the sad fact that the Day Trader does not know what he/she is doing, rather than being a part of a well conceived tactical ploy.

Whilst it is very true that price is our teacher, it is not our tactician.

We are.
We set the rules of engagement.
We decide upon the acceptable casualty rate.

And we decide when to disengage in the face of victory.

regards
f9
 
IronFist,

Practice What You Preach and be consistent with it!!!

....One thing that I learned ....is that price moves in waves. HH/HL, LH/LL...
So basically, if you're going long, you probably have a better statistical chance of being profitable if your long entry is in an uptrend following a series of higher highs and higher lows.


IMHO,

1st trade long = ??? according to your lines you had a LH and HL ...even you want to forget about this statistical edge and take the long in that S Line at least wait for a green candle or a close above of previus bar close and open or the break of the last bar high !!!

2nd Trade long =???? LH and LL
3rd Trade long = ??? LH and LL
4th trade long = ???? LH and LL

And you wonder why you got hammered...

jjrvat

Quote from IronFist:

How bad I did today (12/4/08)

Morning:
12408ym1.gif


6 trades, 1 winner.
 
Here is my full chart for the day. Iron, watch your trendlines, you have them all over the place. Keep support/resistance and only draw the "strong" trendlines to play.

Also, its ok to have a one EMA or something to help you get set straight, I just kinda use it as my compass in case I ever get turned around in the heat of battle.
Also, i dont know if you use any other charts as a larger picture. I also have up some 2-3day 10min charts to help identify a more powerful trend and I also have my pivot points marked on them.
 

Attachments

I don't use tick charts or TL's any more but just for the heck of it I took a 400 tick YM chart for today and marked it how I think I would have done throughout the day. There were several times I would have had to modify the original TL, which I left on the chart. (One reason I don't use them any more) There were at least 7 false breaks that probably would have led to a loss.
And this is with the benefit of hindsight!

http://charts.dacharts.com/2008-12-05/YM400tickTL.png

For some reason my charts disappear from daCharts after 24 hours or so. I have no idea why.
 

Attachments

Here's the same YM 400 tick with how I would normally "view" the PA in terms of simple horizontal S/R levels.
Again I don't use tick charts and if I were I probably wouldn't use one of the "micro"
time frames. I just don't do as well with them. More power to you if you can make them work though.

Also again, this is with the benefit of hindsight. And I don't normally take the time to make notes on my charts during RTH. (I type too freak'n slow)


http://charts.dacharts.com/2008-12-05/YM400ticS-R.png
 

Attachments

Back
Top