
You are using an out of date browser. It may not display this or other websites correctly.
You should upgrade or use an alternative browser.
You should upgrade or use an alternative browser.
In the Coronavirus Fight in Scandinavia, Sweden Stands Apart
- Thread starter wildchild
- Start date

that is the problem with you.
you don't understand that science is repeatable.
If you get the data from his source and show his charts to be wrong...
you are doing science.
if you say...hey I don't like because it does not agree with the narrative you prefer...
you are being a moron.
now the recent charts I posted had the source.
Do you have a problem with Johns Hopkins
or
Ourworldindata?
you don't understand that science is repeatable.
If you get the data from his source and show his charts to be wrong...
you are doing science.
if you say...hey I don't like because it does not agree with the narrative you prefer...
you are being a moron.
now the recent charts I posted had the source.
Do you have a problem with Johns Hopkins
or
Ourworldindata?
You really think a website focused on climate change is a proper source for COVID-19 data --- especially when the data does not agree with all the other official sources. Good luck with that.
Much less when the data source on most of the charts is given as - https://tinyurl.com/rnw2fed
Congratulations to Jem on reaching 30,000 postings. --Quite a feat indeed especially in that they are well thought as a rule. Once again, Congrats!
Time to retire. He has officially wasted more of his life than anyone, possibly in the top few time wasters in the world for this kind of forum.
Good thing he was not raising a family in the past 20 years.
apparently I can see blocked posters when they first post....
It keeps me in the trades longer. When I was making a ton of money trading... that was a good thing. for the last few weeks except for Friday (which was good) it does not matter since my equity has just been bouncing around.
It keeps me in the trades longer. When I was making a ton of money trading... that was a good thing. for the last few weeks except for Friday (which was good) it does not matter since my equity has just been bouncing around.
Time to retire. He has officially wasted more of his life than anyone, possibly in the top few time wasters in the world for this kind of forum.
Good thing he was not raising a family in the past 20 years.
that is the problem with you.
you don't understand that science is repeatable.
If you get the data from his source and show his charts to be wrong...
you are doing science.
if you say...hey I don't like because it does not agree with the narrative you prefer...
you are being a moron.
now the recent charts I posted had the source.
Do you have a problem with Johns Hopkins
or
Ourworldindata?
The data source for most of your charts at the url is - https://tinyurl.com/rnw2fed
Guess that anyone can post a data source on the web --- and then claim it is from source xyz (when there is not proof that it is even associated with xyz).
wattsupwiththat.com needs to provide full disclosure regarding its data sources for COVID, how the data is used. Including their charts in a blog thread that mainly raves that all the deaths and data worldwide is fake --- does not provide any comfort that they are acting as a neutral sources.
Let's take a look at some of the wattsupwiththat.com postings in their COVID blog thread with their charts. https://wattsupwiththat.com/daily-coronavirus-covid-19-data-graph-page/ It's pretty clear what their bias is.


Last edited:
apparently I can see blocked posters when they first post....
It keeps me in the trades longer. When I was making a ton of money trading... that was a good thing. for the last few weeks except for Friday (which was good) it does not matter since my equity has just been bouncing around.
Sure. Anyway I have the beginning of a fever today so may not be around to see you reach 60,000. The silver lining of dying from covid-19.
the data source for this chart can be seen at the very top of the chart...
and this chart destroys your argument.
Sweden as many other countries and states like NY lost a ton of old people in the beginning.
You and Your doomers were constantly warning us about how bad things were in Sweden and how they were doomed...
Yet... without a lock down their deaths per 10 million are very similar to many countries who locked down.

and this chart destroys your argument.
Sweden as many other countries and states like NY lost a ton of old people in the beginning.
You and Your doomers were constantly warning us about how bad things were in Sweden and how they were doomed...
Yet... without a lock down their deaths per 10 million are very similar to many countries who locked down.
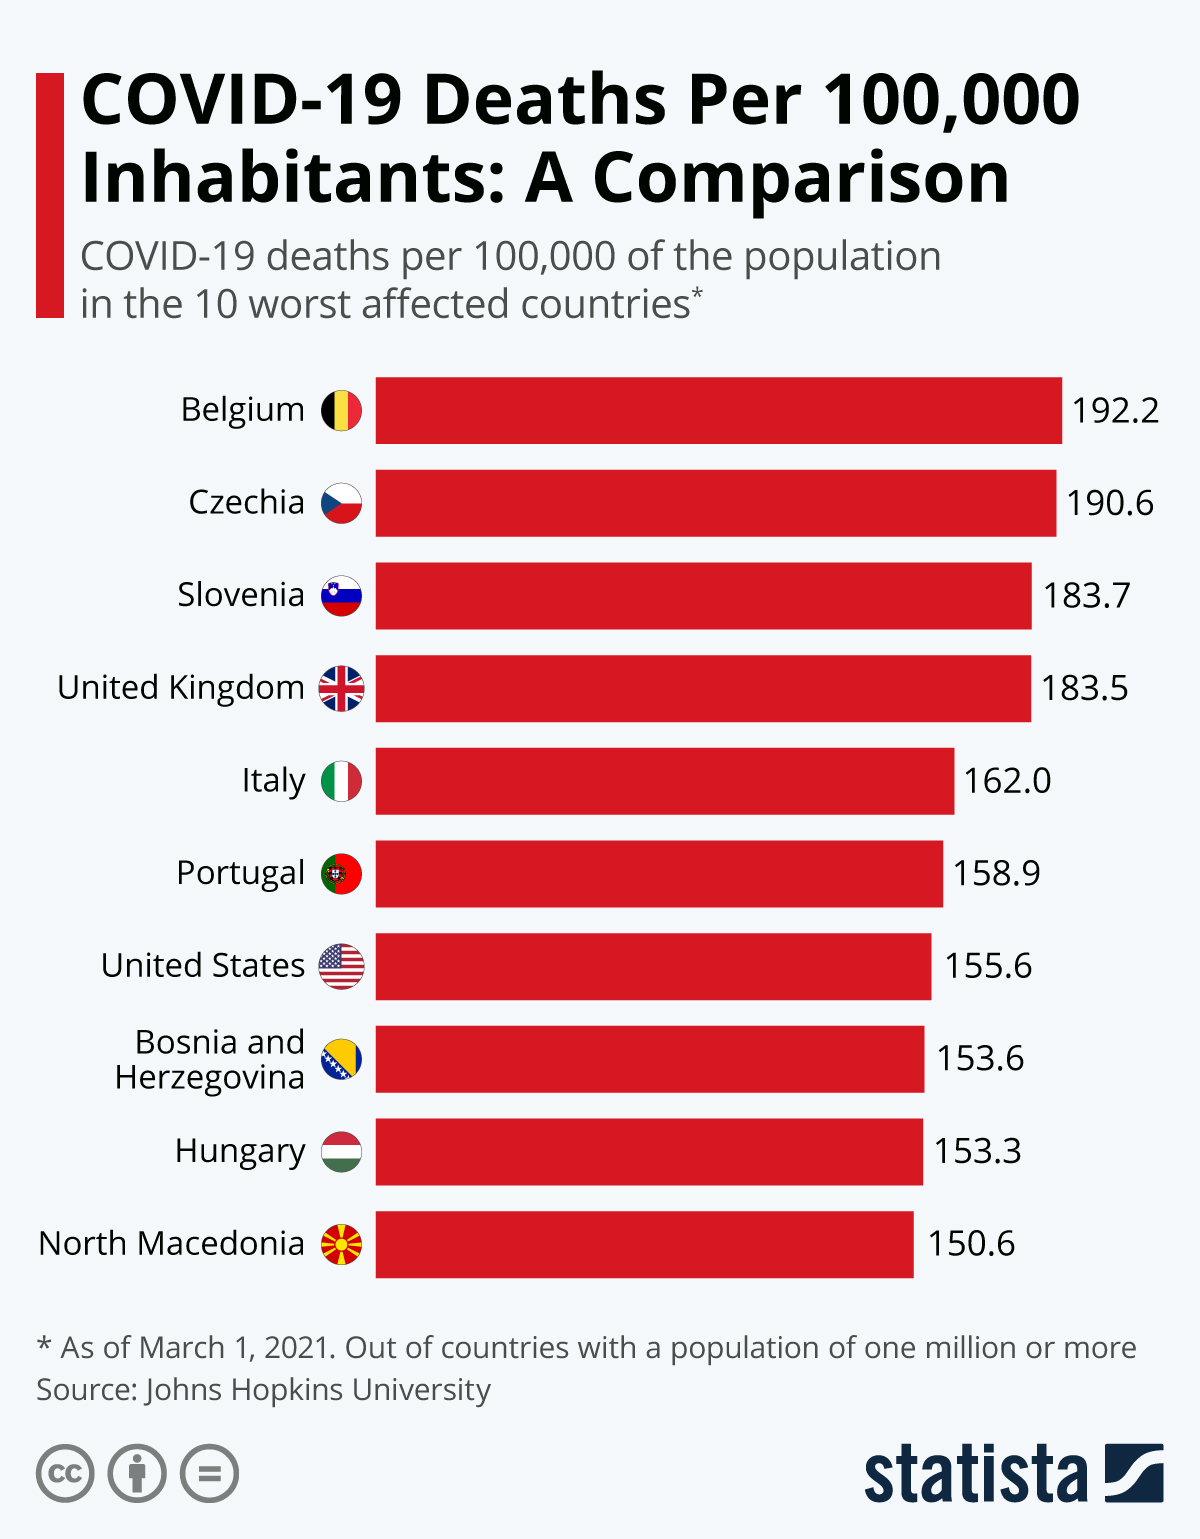
the data source for this chart can be seen at the very top of the chart...
and this chart destroys your argument.
Sweden as many other countries and states like NY lost a ton of old people in the beginning.
You and Your doomers were constantly warning us about how bad things were in Sweden and how they were doomed...
Yet... without a lock down their deaths per 10 million are very similar to many countries who locked down.
Locked down late, how many times does he have to hear the same thing. Countries that locked down early are a very different story.
And who ever said doomed
 again, dumb guys going to Breitfart fish school to turn (a phrase) all at the same time.
Jem.. He has not got the intellect to convince anyone outright so he plays to something that looks like a draw forever. Its our own fault for being so generous to his Sr Leboski like ego.

Sure. Anyway I have the beginning of a fever today so may not be around to see you reach 60,000. The silver lining of dying from covid-19.
You know what to do. Chloroquine and zinc. Go to a doctor to get the dosage right. Please don’t die, else ET’s source of dry humor dies with you.