You are using an out of date browser. It may not display this or other websites correctly.
You should upgrade or use an alternative browser.
You should upgrade or use an alternative browser.
If You Trade Using Moving Averages, How?
- Thread starter easymon1
- Start date
Pretty simple. Directly taken from Investopedia:
- Plot three exponential moving averages—a five-period EMA, a 20-period EMA, and 50-period EMA—on a 15-minute chart
- Buy when the five-period EMA crosses from below to above the 20-period EMA, and the price, five, and 20-period EMAs are above the 50 EMA
- Plot three exponential moving averages—a five-period EMA, a 20-period EMA, and 50-period EMA—on a 15-minute chart
- Buy when the five-period EMA crosses from below to above the 20-period EMA, and the price, five, and 20-period EMAs are above the 50 EMA
I use this.
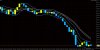
6Lwma hl/2 ( middle Yellow )
Blue is the Envelope 6lwma of the High and the low then +/-0.02% ( adapts it's size this way to candle size )
White is 18lwma
Try to go along with the white, but basically look for a direction with the 6 ( yellow ), join that direction if long as near the bottom Blue as you can, but Mid HL/2 generally has to do.
Let the profits run 70pt move there just on the DAX, and SL outside of the Blue and keep moving to keep outside tight outside of the Blue.
Practice to learn the better setups to avoid death by 1000nd cuts mind")
6Lwma hl/2 ( middle Yellow )
Blue is the Envelope 6lwma of the High and the low then +/-0.02% ( adapts it's size this way to candle size )
White is 18lwma
Try to go along with the white, but basically look for a direction with the 6 ( yellow ), join that direction if long as near the bottom Blue as you can, but Mid HL/2 generally has to do.
Let the profits run 70pt move there just on the DAX, and SL outside of the Blue and keep moving to keep outside tight outside of the Blue.
Practice to learn the better setups to avoid death by 1000nd cuts mind
Attachments
Trading using the moving average is understandable even for a beginner. Moving with the period of 21 days is chosen as a tool. If the price trend crosses it from bottom to top, make sure that the candlestick has closed above the indicator line. On the next bullish candle you can enter into a buy deal. The stop loss is set slightly below the previous local minimum.
When the trend crosses the moving line from top to bottom, you should wait for the closing of the candle below it and open a sell order on the next bearish candle. The stop loss is placed just above the nearest local high. Buy or sell signals are more reliable on the higher time frames.
False breakouts of moving average also happen. In this case it is possible to lose funds from an investor's deposit. To filter out false signals for market entry, you should additionally set the stochastic oscillator on the chart of the selected asset. Experienced traders note that sometimes after a breakthrough of the moving average, the price returns to it, and then rushes back again with renewed force.
Trend analysis of the selected asset depends on the Moving Average period duration settings. The larger the number stands in the indicator settings, the longer the trend period it analyzes and, accordingly, gives a more reliable signal to enter the market. Reducing this number increases the inaccuracy of the analysis, giving a lot of false signals. Which period is better to set in the moving settings? There is no unambiguous answer to this question.
If You Trade Using Moving Averages, How?
In my opinion moving averages work best as an objective exit tool.
On the other hand they generate tons of false signals if used for entry after a cross over.
John Ehlers' work is what you want to look at.
Did he post any backtest somewhere?
There are dozens and dozens of moving averages from different authors and they all claim to be "better" than a simple moving average.
When I was doing some day trading using MAs, I used to have a 34/144/610 set of exponential moving averages. If they were aligned from shortest to highest to the upside or downside on the H1 chart, I'd go down to M15 and buy/sell into the first pullback onto them. This works basically in any time frame. For a more sophisticated version, I'd switch the 34 EMA for a 34 exponential Bollinger Band using 0,25 - 0,5 Standard Deviations, which would act as the margin of error for either side.
Honestly, I don't see the point of using MAs if you don't replace them with Bollinger Bands. I wanna know the average AND how much price has deviated from it or, if you're using them as crossovers, I wanna make sure that they've at least crossed their deviations (e.g. 0,5 on the 34 and 0,25 on the 144).
Honestly, I don't see the point of using MAs if you don't replace them with Bollinger Bands. I wanna know the average AND how much price has deviated from it or, if you're using them as crossovers, I wanna make sure that they've at least crossed their deviations (e.g. 0,5 on the 34 and 0,25 on the 144).