I note that the general theme of this thread is not necessarily about the price pattern itself(listed in the schema), but rather becoming an expert at some particular price behavior, trading that ALONE, while avoiding the pitfalls traders typically take by overtrading, overleveraging, and not being able to wait for the ONE niche, studied activity to occur. I believe there is value in that idea.
I have spent time trying to do this in the past, but the problem I had doing this with Price Patterns, is that I found them to be so subjective. The brain seems to struggle with pinning price behavior into various boxes to be able to identify THAT setup. And if that is not the issue, I seemed to have observed that when looking at the success/failure rates of patterns, it seems like patterns like this always fail just as often as they do what you think they would. Is overcoming this hurdle simply a matter of not being an expert at identifying that pattern, or understanding when it might do what you think it should?
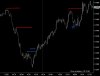
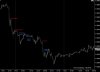
For Example, attached in "Ex1," I note another possible occurrence, where there is a strong down move, with a few swing highs created on the way down. Followed by the 'trigger,' then a strong move up without much evidence of 'stops taken.' Later on, there does appear to be that activity(stops taken) which is a bit later than the examples early on in the thread. While this is a bit different than the examples given early on, I think this one is a bit similar.
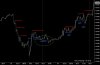
In attached pic, "Ex2," another example 5 days later on a 15m chart... with the decline, followed by the 'triggered' which I see as quite obvious. The confusion I would have, following the 'stops taken' here, where it essentially happens 3 times(green circle). The question would be how you classify such behavior relative to your examples? Directly to the right of that, that 'stops taken' is a bit more clear(yellow circle) as stops are taken once. The pattern to the right of the yellow circle, each target(red line), is even clearer as it only happens once each time it hits the target line.
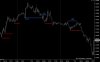
"Ex3," A case to the upside. The 'stops taken' appears to go a bit above the line here. With another example far to the right of that one, that is a bit more clear cut with a minimal break of the 'stops taken' line.
Another Example in "Ex4." Here this is also to the upside, where the normal activity again occurrs up to the 'trigger' point. Then again, 'stops taken' appears to cause confusion, as a case could be made for it happening several times, with wide ranges of price. For something like this, would this just be considered a failure of the pattern, and included in the basket of where this pattern breaks down.
Lastly, "Ex5," might depict possible failures. There are two in this picture. After the FIRST 'triggered' line, there is a place where there is a potential 'stops taken.' Although there is never a new high made afterwards. It could be the idea is to wait for the first sign of 'stops taken' before looking to trade THIS pattern? To the right, the 2nd 'triggered' line has a similar behavior. In both these examples, it could be simply that there isn't enough information to begin looking for trades in either of these, but I guess this is up to the observer to study and decide.
While the OP has made note of the necessity of 'study' to become an expert at a given behavior, I was finding that even identifying the required number of examples problematic. In the 50+ examples, are failures of such patterns included?
Just to say, none of these questions or observations are a knock on the content of the thread itself, as I think the idea(of understanding one thing well while eliminating trader mistakes) has merit and am wondering how to go about removing the subjectivity and variations, or whether to include failures of perceived patterns.
With that being said, I imagine the same ideas in this thread could be applied to just about anything? Has anyone thought of some type of behavior that is a bit more objective in it's identification?
I have spent time trying to do this in the past, but the problem I had doing this with Price Patterns, is that I found them to be so subjective. The brain seems to struggle with pinning price behavior into various boxes to be able to identify THAT setup. And if that is not the issue, I seemed to have observed that when looking at the success/failure rates of patterns, it seems like patterns like this always fail just as often as they do what you think they would. Is overcoming this hurdle simply a matter of not being an expert at identifying that pattern, or understanding when it might do what you think it should?
For Example, attached in "Ex1," I note another possible occurrence, where there is a strong down move, with a few swing highs created on the way down. Followed by the 'trigger,' then a strong move up without much evidence of 'stops taken.' Later on, there does appear to be that activity(stops taken) which is a bit later than the examples early on in the thread. While this is a bit different than the examples given early on, I think this one is a bit similar.
In attached pic, "Ex2," another example 5 days later on a 15m chart... with the decline, followed by the 'triggered' which I see as quite obvious. The confusion I would have, following the 'stops taken' here, where it essentially happens 3 times(green circle). The question would be how you classify such behavior relative to your examples? Directly to the right of that, that 'stops taken' is a bit more clear(yellow circle) as stops are taken once. The pattern to the right of the yellow circle, each target(red line), is even clearer as it only happens once each time it hits the target line.
"Ex3," A case to the upside. The 'stops taken' appears to go a bit above the line here. With another example far to the right of that one, that is a bit more clear cut with a minimal break of the 'stops taken' line.
Another Example in "Ex4." Here this is also to the upside, where the normal activity again occurrs up to the 'trigger' point. Then again, 'stops taken' appears to cause confusion, as a case could be made for it happening several times, with wide ranges of price. For something like this, would this just be considered a failure of the pattern, and included in the basket of where this pattern breaks down.
Lastly, "Ex5," might depict possible failures. There are two in this picture. After the FIRST 'triggered' line, there is a place where there is a potential 'stops taken.' Although there is never a new high made afterwards. It could be the idea is to wait for the first sign of 'stops taken' before looking to trade THIS pattern? To the right, the 2nd 'triggered' line has a similar behavior. In both these examples, it could be simply that there isn't enough information to begin looking for trades in either of these, but I guess this is up to the observer to study and decide.
While the OP has made note of the necessity of 'study' to become an expert at a given behavior, I was finding that even identifying the required number of examples problematic. In the 50+ examples, are failures of such patterns included?
Just to say, none of these questions or observations are a knock on the content of the thread itself, as I think the idea(of understanding one thing well while eliminating trader mistakes) has merit and am wondering how to go about removing the subjectivity and variations, or whether to include failures of perceived patterns.
With that being said, I imagine the same ideas in this thread could be applied to just about anything? Has anyone thought of some type of behavior that is a bit more objective in it's identification?