If you lost money trading in 2016 here is my xmas gift to you

When I say crosses I mean EURGBP AUDNZD and not major pairs. In my experience they behave differently as they don't have unique order flow.
Oh ok. I thought you were earlier referring to yen crosses and I am focussing only on GBPJPY only. Thanks again.
 
Live Trade example in real time right now. Does anyone notice anything to the left of the marked setup.

pic9.png
 
Post 5/10 Stops Taken, Retracements & How Price Moves

The post explains how and why price moves. Let us suppose that price is going to move from point A to B. Of course we never know that for sure in advance that it will move from A to B however we can use a methodology to guide us (see earlier posts). So assuming price is going to move from point A to B it's easy right? All we need to do is get in a point A and get out at point B. Wrong! Price very rarely moves directly from point A to point B. The only occasions it does that is on a scheduled/unscheduled data release which differs greatly from market expectations. What I am concerned with here is the way price moves from A to B 99% of the time.

The collective aim of the market is to move in such a way that as many people as possible do not manage to enter at A and exit at B. The collective action of the market does this it 2 ways.

(i) taking stops - it moves to take out stops of trend following trader who jam their stop up under the last major swing high/low.

(ii) deep retraces - it retraces more than 50% of the last swing high/low to try and trick the trader into closing out their position.

Imagine you managed to nail a buy on the last swing low in an upmove, you feel great, then a retrace starts. How far does it need pullback/retrace for you to sweat and close your position? The answer is it needs to retrace enough to get the majority of traders to close out. Most people naturally start sweating at a 50% retracement, 60% sweatier, 70% sweatier still, 80% retrace and majority are out. Price then rips to make a new high.

You will see these 2 price behaviours on all time frames however the 'taking stops' are more prevalent on lower time frames as algos and the collective market look to aggressively close people out.

You need to study the 2 examples below exhaustively. In each case the horizontal blue lines show 'taking stops' and the red lines show retraces of the last swing which are more than 50%.

How does this help you? Well now you have the structure as to how price moves and you can monitor this on a lower time frame with a higher time methodology in mind. You should formulate an entry as close as possible to where you know you are wrong.

Next post - Trade Management

pic10.png
pic11.png
 
This is going to be short and sweet. I will lay it out in 10 posts and why this and nothing else will work for 90%+ people. I am a trader and I fully expect people to troll the hell out of this thread. Do I trade like this? No. but is a component in price I watch for and in addition I am not telling you to trade like this. Before it starts, No, I do not teach, No I do not mentor. Is this my material? No. The schematic is pulled straigt from google images and originally appeared in Wyckoff's work 100 years ago. If you are a profitable trader please just move along to the next thread, this thread is for losing traders only.

I will start with 2 images. First the schematic and second today's price action in spot EURUSD.View attachment 169089View attachment 169090
As you foretold, you'll probably need your fire-retardant suit soon. Meanwhile, good stuff. Merry Christmas!
 
This is going to be short and sweet. I will lay it out in 10 posts and why this and nothing else will work for 90%+ people. I am a trader and I fully expect people to troll the hell out of this thread. Do I trade like this? No. but is a component in price I watch for and in addition I am not telling you to trade like this. Before it starts, No, I do not teach, No I do not mentor. Is this my material? No. The schematic is pulled straigt from google images and originally appeared in Wyckoff's work 100 years ago. If you are a profitable trader please just move along to the next thread, this thread is for losing traders only.

I will start with 2 images. First the schematic and second today's price action in spot EURUSD.View attachment 169089View attachment 169090


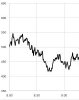
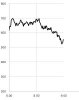
Not doubting your abilities as a trader, but I'm just curious to know whether I should invest my time in learning your method. Its very easy to analyze a chart and discuss your trades in hindsight. So think of this as a litmus test...

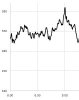
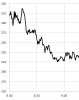
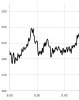
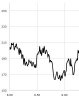
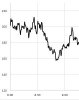
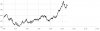
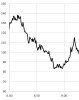
So here are 10 snapshots of some randomly selected stocks. Just state whether you would go LONG or SHORT at the specified time, which is normally 15 - 30 mins after where the graphs are blanked out. Bonus points for determining what profit targets / stop losses you'd set.

I will post the complete charts after your reply.

1. GRAPH 1 PRICE at 11.30am?
2. GRAPH 2 PRICE AT 9.15am?
3. GRAPH 3 PRICE AT 9.30am?
4. GRAPH 4 PRICE AT 9.30am?
5. GRAPH 5 PRICE AT 9.30am?
6. GRAPH 6 PRICE AT 9.30am?
7. GRAPH 7 PRICE AT 9.30am?
8. GRAPH 8 PRICE AT 9.30am?
9. GRAPH 9 PRICE AT 11.00am?
10. GRAPH 10 PRICE AT 9.30am?
 

Attachments

  • Graph 1 price at 11.30.jpg
    Graph 1 price at 11.30.jpg
    38.8 KB · Views: 92
  • GRAPH 2 PRICE AT 9.15am.jpg
    GRAPH 2 PRICE AT 9.15am.jpg
    11.4 KB · Views: 70
  • GRAPH 3 PRICE AT 9.30am.jpg
    GRAPH 3 PRICE AT 9.30am.jpg
    17.3 KB · Views: 56
  • GRAPH 4 PRICE AT 9.30am.jpg
    GRAPH 4 PRICE AT 9.30am.jpg
    12.6 KB · Views: 51
  • GRAPH 5 PRICE AT 9.30am.jpg
    GRAPH 5 PRICE AT 9.30am.jpg
    15.6 KB · Views: 51
  • GRAPH 6 PRICE AT 9.30am.jpg
    GRAPH 6 PRICE AT 9.30am.jpg
    16.2 KB · Views: 45
  • GRAPH 7 PRICE AT 9.30am.jpg
    GRAPH 7 PRICE AT 9.30am.jpg
    13.6 KB · Views: 44
  • GRAPH 8 PRICE AT 9.30am.jpg
    GRAPH 8 PRICE AT 9.30am.jpg
    14.2 KB · Views: 44
  • GRAPH 9 PRICE AT 11AM.jpg
    GRAPH 9 PRICE AT 11AM.jpg
    22.1 KB · Views: 48
  • GRAPH 10 PRICE AT 9.30am.jpg
    GRAPH 10 PRICE AT 9.30am.jpg
    14.8 KB · Views: 48
A real-time display would be nice.

He did 2 real time trades in this thread. The 1st one worked out, the 2nd one didn't in the direction he showed but w/ good trade management it shouldn't be a problem in term of total profit.
 
Back
Top