I'm a fan of COT analysis : actually I love to study COT reports and positioning.
recently I subscribed to iCOT indicator where they introduce it as the approximate intraday COT chart.
As per the iCOT description : it is an intraday technical indicator trying to simulate and approximate COT reports.
tbh : I got amazed by how accurate to pinpoint major reversal points.
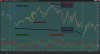
here I got screenshot from youtube video they introduce :
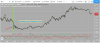
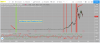
here a screenshot for how they measure extremes of commercial/speculators on intraday timeframes : https://paste.pics/BYVR0
i will keep posting charts for different symbols catching my eye.

If you are interested in any symbol : please ask and I will share its chart.
lets see it.
recently I subscribed to iCOT indicator where they introduce it as the approximate intraday COT chart.
As per the iCOT description : it is an intraday technical indicator trying to simulate and approximate COT reports.
tbh : I got amazed by how accurate to pinpoint major reversal points.
here I got screenshot from youtube video they introduce :
here a screenshot for how they measure extremes of commercial/speculators on intraday timeframes : https://paste.pics/BYVR0
i will keep posting charts for different symbols catching my eye.
If you are interested in any symbol : please ask and I will share its chart.
lets see it.