You are using an out of date browser. It may not display this or other websites correctly.
You should upgrade or use an alternative browser.
You should upgrade or use an alternative browser.
Ichimoku Futures Trading
- Thread starter IchibomB
- Start date
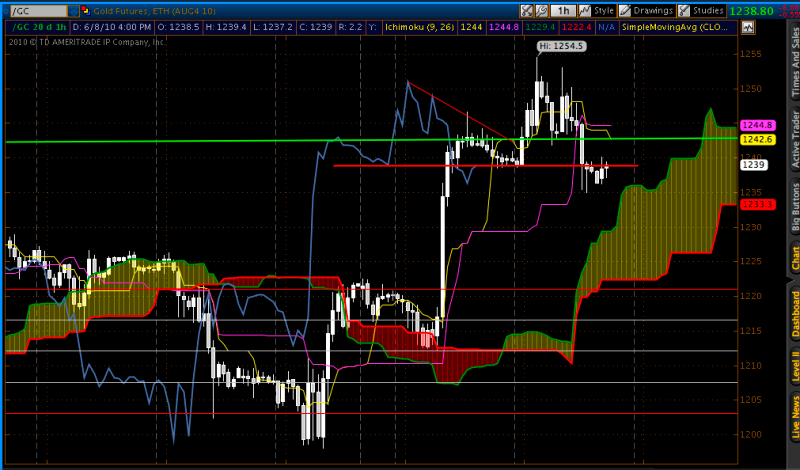
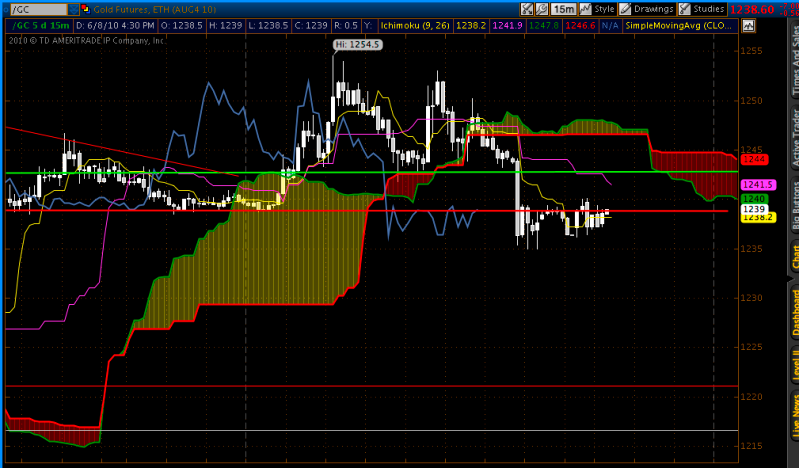

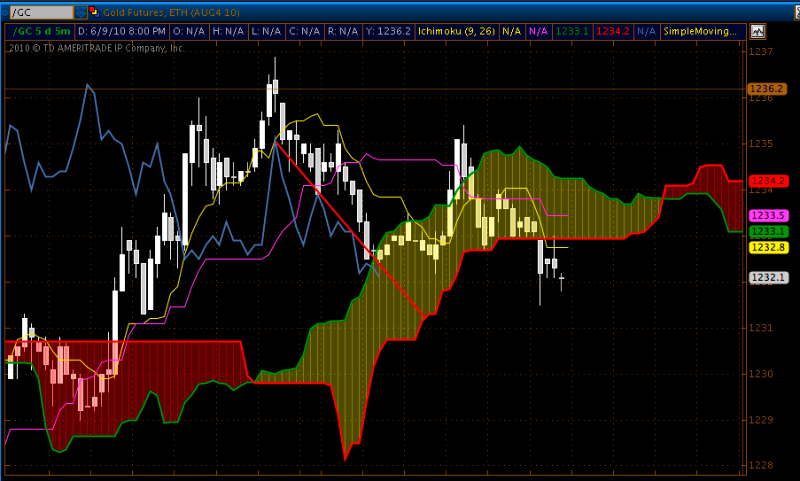
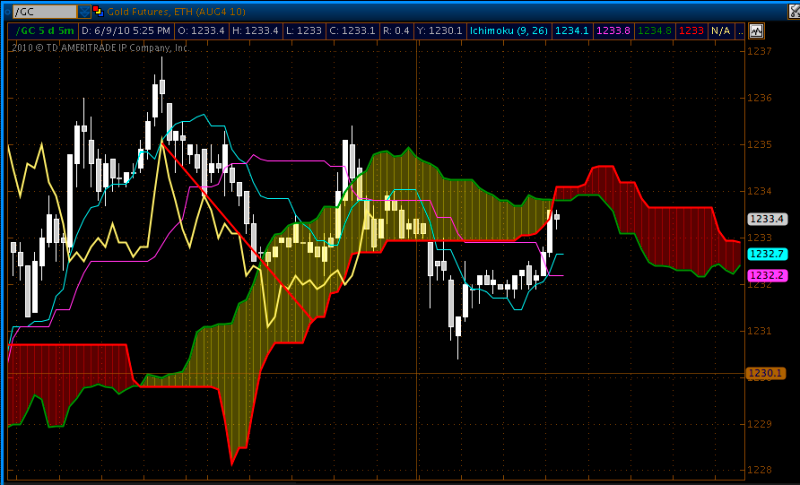
Looking at another short here if price stays below the cloud on the 5 minute. So short below the cloud when TS/KS exit and CS remains below the trendline. CS below the cloud would a nail in the coffin.
Long if the CS trendline is broken. I'll also be looking for a bullish TS/KS cross with price above the cloud for a long position.
Personally, I feel more comfortable with the risk/reward of the short.
Long if the CS trendline is broken. I'll also be looking for a bullish TS/KS cross with price above the cloud for a long position.
Personally, I feel more comfortable with the risk/reward of the short.
With stocks in the $2-$10 range I was averaging a 75% win ratio with a win considered at least 10% in profit. Average monthly profit was 22% over a 6 month span.
When the Dow took a dive I decided to start studying futures .
What we're working with here are 4 formulas consisting of:
TS blue line - (highest high+lowest low)/2 for the past 9 periods
KS pink line - (highest high+lowest low)/2 for the past 26 periods
SSA - green cloud line - (TS + KS)/2 for the past 26 periods projected 26 days ahead
SSB - red cloud line - (highest high+lowest low)/2 for the past 52 periods projected 26 days ahead
CS - yellow line - Price action represented as a line chart 26 periods in the past.
The cloud which is made up of SSA and SSB shows us equilibrium.
This is a pivotal point where stocks may make strong moves
in either direction while exiting the cloud.
Cloud Thickness
High Volatilty: thicker - stronger support/resistance
Lower Volatility: thinner - weaker support/resistance.
Long Positions
Any signals that occur above the cloud are considered strong.
Any signals that occur inside the cloud are considered neutral.
Any signals that occur below the cloud are considered weak.
The inverse can be said for short positions.

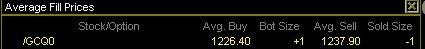
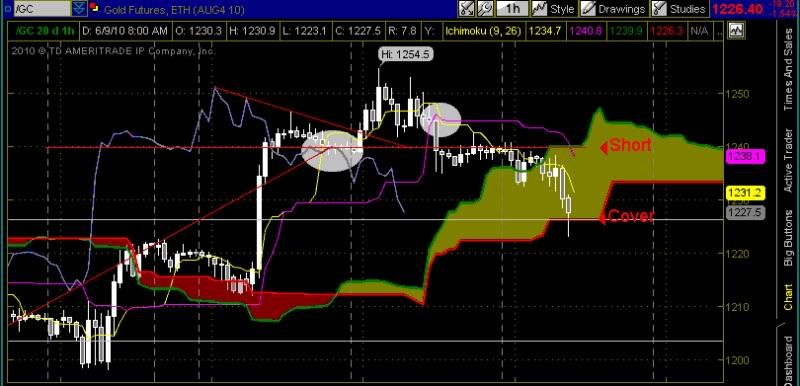
Shorted at 1224. Covered at 1220 (2 lots)

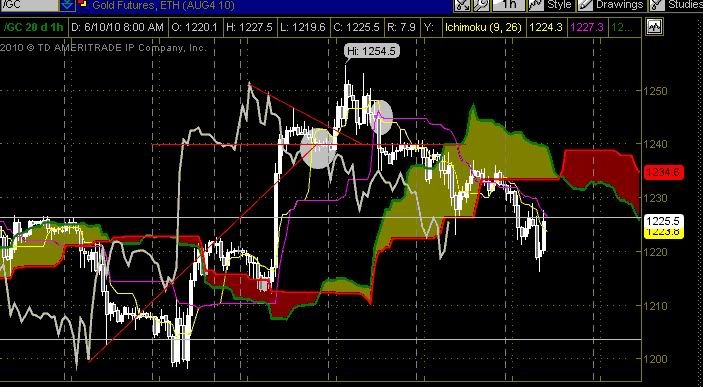
I was sitting at the computer last night telling Dani (girlfriend) that Gold is going down tonight (it was at 1232). I wanted to short it before I went to bed to wake up to some big profits. She asked if I would do it with my live account and I said no. The signals were there though and I wasn't that surprised when I woke up to see Gold at 1220.
I was sitting at the computer last night telling Dani (girlfriend) that Gold is going down tonight (it was at 1232). I wanted to short it before I went to bed to wake up to some big profits. She asked if I would do it with my live account and I said no. The signals were there though and I wasn't that surprised when I woke up to see Gold at 1220.