
You are using an out of date browser. It may not display this or other websites correctly.
You should upgrade or use an alternative browser.
You should upgrade or use an alternative browser.
Ichimoku ES Futures Trading
- Thread starter IchibomB
- Start date

4.3 point move

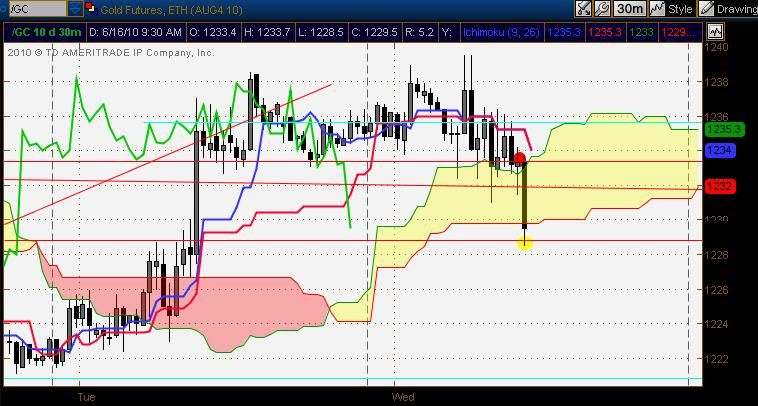
30 minute
5 short signals total
1 - CS breaking it's trendline
2 - CS falling below price action
3 - Price falling below TS on the daily (light blue price line)
4 - Price falling below 30 minute TS/KS which were together and pointing down
5 - Price break in the cloud
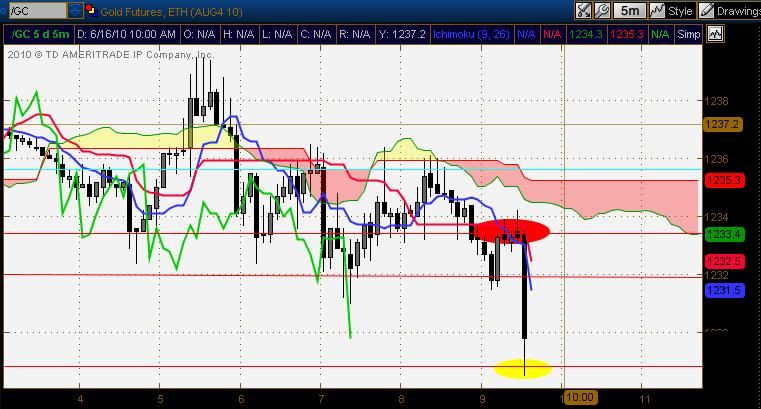
5 minute - Waited for the bear TS/KS cross below the cloud for the play.
I got out when I saw it bounce off of daily CS support (highlighted in yellow)
30 minute
5 short signals total
1 - CS breaking it's trendline
2 - CS falling below price action
3 - Price falling below TS on the daily (light blue price line)
4 - Price falling below 30 minute TS/KS which were together and pointing down
5 - Price break in the cloud
5 minute - Waited for the bear TS/KS cross below the cloud for the play.
I got out when I saw it bounce off of daily CS support (highlighted in yellow)
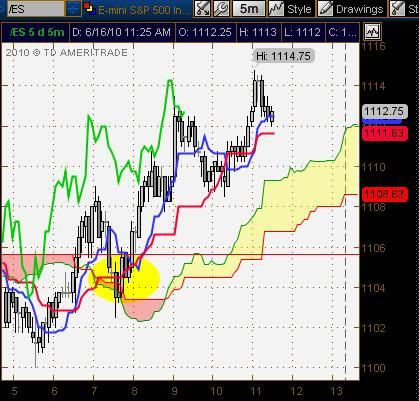
This short cover was also your buy on the 5 minute this morning which is where a lot of my long positions are grabbed. Bull TS/KS cross above the cloud. Basically, anytime you see price on the other side of the cloud, it's telling us that the price has just tipped in the buyers favor. Watch the shorts cover...
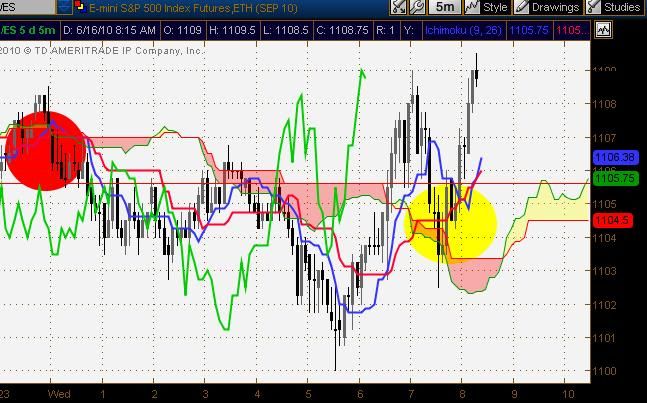
1105 to 1110 5 point ES play on the bear TS/KS cross for your exit.
Quote from JeffUSA:
I find the Ichimoku indicator fascinating. Do you know of any good sites to read up on this and study it?
http://www.fxwords.com/u/ichimoku-cloud.html
http://www.ichi360.com/?p=487
I am not a great fan of indicators at anytime...however I plead guilty to using Ichi....the truth is that I bastardized the parameters and have been using it very successfully with stocks the last 3 years.
The only REAL success I have had in commodities using Ichi is oil...4 price bar range...52,1,9...trade it at your own risk.
NiN
The only REAL success I have had in commodities using Ichi is oil...4 price bar range...52,1,9...trade it at your own risk.
NiN