Hello,
today I noticed, that TWS gives me differnt stock prices (in charts) as my other plattforms like TradingView or DASTrader.
I assume that is a setting on TWS and not really a bug in TWS, but at the moment I'm completely confused.
When I compare daily charts between TWS and TradingView/DASTrader, it looks really different. Candles have different High, Close, Open and Low Prices. Even candles are different colors. Strange...
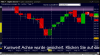
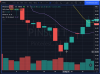
I have attached two Screenshots (TradingView and TWS). As an example, I have selected PINS (NYSE) in the area 20.8.2021.
In TWS: Candle for "PINS (NYSE)" for the days 19 and 20.August are nearly identically. In TradingView you can see that the 20 is a "much" better day as the 19.August.
Does anyone have an idea?
Thanks
Robert
today I noticed, that TWS gives me differnt stock prices (in charts) as my other plattforms like TradingView or DASTrader.
I assume that is a setting on TWS and not really a bug in TWS, but at the moment I'm completely confused.
When I compare daily charts between TWS and TradingView/DASTrader, it looks really different. Candles have different High, Close, Open and Low Prices. Even candles are different colors. Strange...
I have attached two Screenshots (TradingView and TWS). As an example, I have selected PINS (NYSE) in the area 20.8.2021.
In TWS: Candle for "PINS (NYSE)" for the days 19 and 20.August are nearly identically. In TradingView you can see that the 20 is a "much" better day as the 19.August.
Does anyone have an idea?
Thanks
Robert