
You are using an out of date browser. It may not display this or other websites correctly.
You should upgrade or use an alternative browser.
You should upgrade or use an alternative browser.
I am not fooled...it is time to sell sell sell!
- Thread starter blowingup2012
- Start date

Quote from Grandluxe:
Election year..second crowning of Obama.
mkt is going to go to new highs under Obama, going short is going against Obama, you want to do it, go ahead.
I don't think it has anything at all to do with Obama, quite frankly. There is nothing about that administration that would enhance retained earnings unless you are looking for insider sweetheart DOE funding.
Chasing yield.
Last year during the lows the herd was looking for a total collapse.
Now it sems the herd is looking for a total breakout.
Bottomline I don't trust the herd one bit.
Now it sems the herd is looking for a total breakout.
Bottomline I don't trust the herd one bit.
Quote from Wide Tailz:
Just like 2 weeks ago, 5 weeks ago, and 8 weeks ago?
I see one itty bitty little red candle at the top of mountain of volume and momentum. You could be right, but I thought you needed to wait for volume to fall off before shorting a parabola?

Please point out this "mountain of volume," or what you see as that.
Quote from Wide Tailz:
Just like 2 weeks ago, 5 weeks ago, and 8 weeks ago?
I see one itty bitty little red candle at the top of mountain of volume and momentum. You could be right, but I thought you needed to wait for volume to fall off before shorting a parabola?
I do think there is more holding up the market then Apple. Apple isnt a part of the DJIA yet the DJ is breaking out over last years highs. The stocks over last year's high on the DJ are:
CAT
CVX
DIS
HD
IBM
INTC
MCD
MRK
PFE
PG
T
VZ
WMT
XOM
Breaking it down into categories its:
CAT, PG - Multinational conglomerates
DIS, HD, WMT, MCD - Consumer Discretionary
IBM, INTC, VZ, T - Select technology
XOM, CVX - Megacap oil companies
MRK, PFE - Big cap pharma
Looking at the sector etfs we find that technology, consumer staples, consumer discretionary and healthcare are not only over last years high, but over the 2007 high. The XLP, XLY and XLV are at lifetime highs while the xlk is at 1999 pricing.
However, none of that really matters. What matters is that its March and typically around this time or sometimes a little later we get these panics.
This chart on the velocity of M2 Money stock might interest you.

I am not a Fed Governor nor do I have any formal knowledge of how they operate, the chart seems to suggest either the Fed has knowledge of recessions years before they occur or the Fed pumping money into the system is causing the recessions.
Another interesting chart:
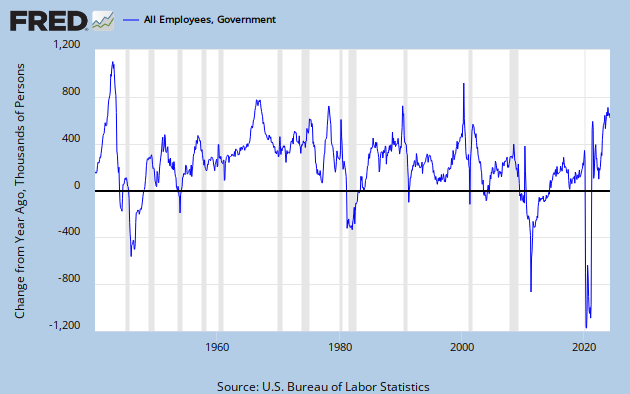
The cutting of government jobs has been associated with recessions of the past.
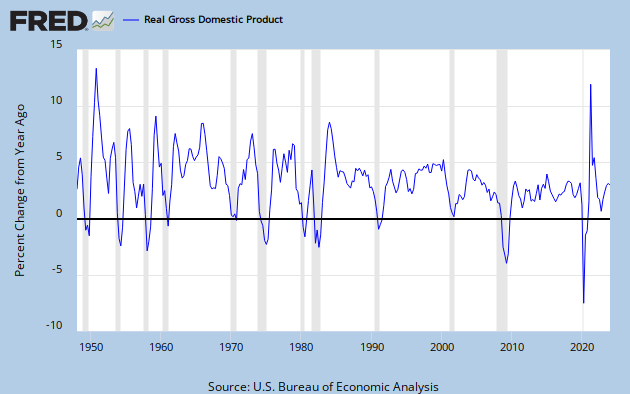
Finally, the GDP chart. Year over year GDP has been descending since 2010 and this is why the ECRI is predicting a recession.
You see. The Fed is flooding the markets with liquidity and that is what is propping up the indexes. Notice how the pump isnt being so widely received by the small caps or the IWM as those stocks do not receive as much benefit from a good old money pump.
At the end of 2007 stocks were surging and then the recession hit. This also happened in 2000 and 1991. The markets usually move up to a high based on money printing, but the money printing effect only lasts so long.
This information is absolutely useless to a daytrader whose only world is the hourly or 15 minute chart. If you daytrade, that is the only chart you should be looking at. However, if you have large amounts of money in long term accounts then this information should be useful.
I have chosen to take time off and am now in cash. Im no wizard, I have no idea what the next day or next month will bring. I am oftentimes wrong. However, I have a good sense of risk management and know that 2012 will be a risky year. If the economy was so good, then why does Obama only command a 44% approval rating in the Gallup poll. Obviously, something is wrong.
Enough already. Uncle! Please don't ruin your vacation and our trading by continuing to post when you said you wouldn't do it anymore. Instead you should focus on your business. Maybe you can increase your business revenue by cleaning more toilets so then you can afford to fly to your vacation first class on a first class airline. Good luck.
small traders lose, they just lose.
Get higher education, get an mba
Get higher education, get an mba