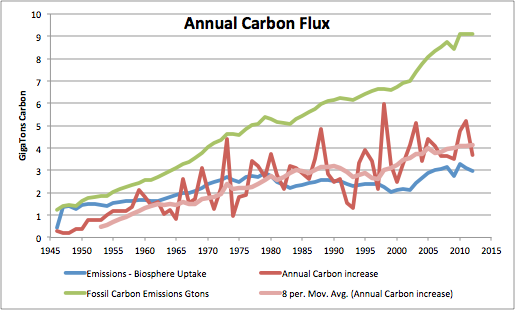
interesting chart... but lets drill down to see if the annual carbon increase actually matches up with man made co2.
you can see man made co2 the green line... goes up in a steady manner.
the annual carbon increase curve far more close resembles change in ocean temps.
I will post the next chart that shows... that shows the paper which explains that the carbon curves follows change in ocean temps very close...and lags by 12 months.
The shape of the annual carbon increase resembles the shape of the global sea surface temperature (HADSST3), especially after reliable CO2 measurements began by Keeling after March 1958. Several known events are visible. Counting backwards: the 1998 El Niño, the 1994-5 El Niño, Mt Pinatubo in 1991, the 1986-7 El Niño, Mt Ruiz in 1985, El Chichon eruption in 1982, the 1972-3 El Niño, etc. Every positive peak is an El Niño and every negative peak is associated with a major volcanic eruption.
As can be seen in Figure 1, there is no relationship between the fossil carbon emissions curve and the annual carbon increase curve. That is because all the fossil emissions carbon is taken up by the biosphere or by the oceans according to Henryâs Law, and then sequestered there. The carbon in the atmosphere is controlled by temperature. This has been described by Dr. Murry Salby in this presentations at Sydney and Hamburg. He compares the CO2 curve to the integral of temperature. Here, I am going the other way mathematically, taking the differential of the CO2 curve as temperature and comparing it to known temperature data, the HADSST3 data.
- See more at:
http://notrickszone.com/2013/10/08/...-co2-and-not-vice-versa/#sthash.gBOX3Ftl.dpuf
----
"The maximum positive correlation between CO2 and temperature is found for CO2 lagging 11â12 months in relation to global sea surface temperature, 9.5-10 months to global surface air temperature, and about 9 months to global lower troposphere temperature. The correlation between changes in ocean temperatures and atmospheric CO2 is high, but do not explain all observed changes."
See:
http://dx.doi.org/10.1016/j.gloplacha.2012.08.008