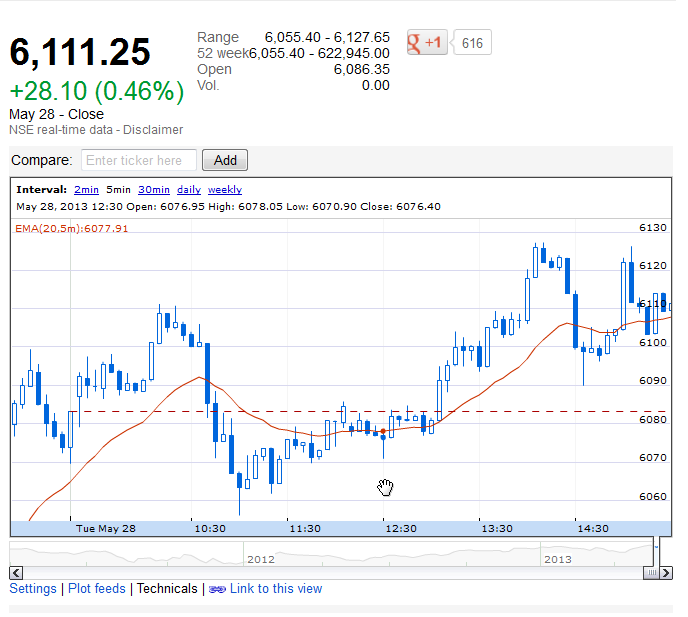
How you would trade this intraday chart and with explantion ?

20 EMA is used on 5 min Nifty chart
1777037785ae459fb7ea6c9af4d9080f6c0e1b36.png
 
Quote from Equity421:

20 EMA is used on 5 min Nifty chart
1777037785ae459fb7ea6c9af4d9080f6c0e1b36.png
==================
E21;
Chart link is not working;
but i sometimes use a 5 minute or daily chart for entry[not closed out @ end of day]:cool:
 
Quote from Equity421:

20 EMA is used on 5 min Nifty chart

http://cdn3.traderslaboratory.com/f...939032-re-trading-off-daily-charts-image5.png

Given your parameters and with a gun to my head and put as simply as I can:

1. Go long in anticipation of the exit from the opening range.

2. Go short off the failure to make a higher high.

3. Go long again off the higher low.

4. Go short off the lower high.

5. Go long off the midpoint of the decline. Quit when price can't make a higher high.

Though there's no great trick to trading a hindsight chart. And I'd never trade something I knew nothing about. And I trade a 1m chart. And I don't use candles or indicators.

But it's all in fun, isn't it?
 
Back
Top