Susana, i would recommend you read a book by Joe Dinapoli (someone i respect a lot). He uses an approach similar to yours (looking to enter on pullbacks) using a well defined and simple method using Fibonacci levels. He uses the fib extension tool for targets, and most importantly, the method is easy to learn, back test, and forward test so you can get an idea pretty fast. heres a quick chart exemple.
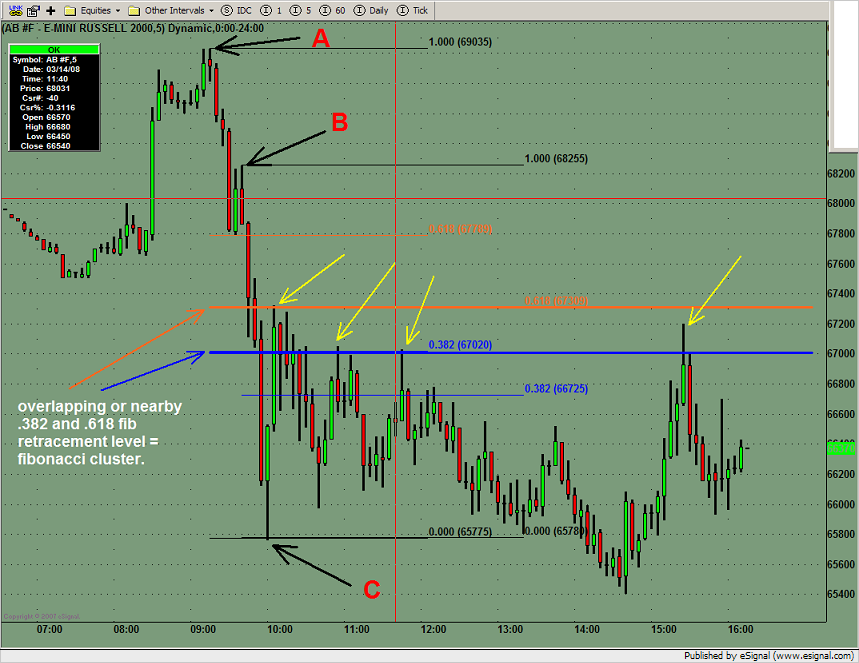
This is last friday on ER2. Consider the downswing AC. you then add a fib retracement between AC, then BC. If you get overlapping .618 and .382 levels from the 2 swings, or if they are very close to each other, its a fibonacci cluster. Dinapoli would want to enter short there since its a zone of strong resistance. look how it worked all day. yellow arrow indicate possible entry points according to his method.
pm me if you want it.
also if you want to translate what jack said up there into something intelligible, i can also provide you with a book on something called volume spread analysis, which is pretty much what Mr hersey is referring to. the study and correlation between volume and price. Here is a quick exemple.
